Previously I discussed the recent Gonzales poll on the Howard County executive race, focusing on the poll’s margin of error (part 1 and part 2). As I noted in a comment, the margin of error was not really a controversial topic; other than having fun computing margins of error, the major reason I wrote the post was to note that the breakdowns by county council district had very high (and unreported) margins of error, and therefore probably didn’t have much more than entertainment value.
The more controversial aspect of the Gonzales poll was the assumed breakdown of likely voters by party:
Democrats were skeptical of the results, particularly because they are based on the premise of a turnout of 46% of Democrats—about 3 points lower than recent elections—and 40% for Republicans—at least 2 points or more higher than [the] usual GOP showing.
A separate poll conducted for Ken Ulman by Garin-Hart-Yang Research Group (which had Ulman leading Trent Kittleman 57% to 32%) used a much different assumption on relative shares of the electorate, though it also tested the Gonzales assumption:
The Yang poll sampled 50 percent registered Democrats, 33 percent registered Republicans and 17 percent unaffiliated voters. . . .
Yang also presented his poll results using a sample of 46 percent Democrats, 40 percent Republicans and 14 percent independents. In that grouping of the Yang poll, Ulman received 53 percent of the vote compare[d] to Kittleman’s 36 percent (11 percent still went to the undecided voters).
How likely are these assumptions? Beyond “gut feel” estimates about the relative proportions of Democrats, Republicans, and unaffiliated and other voters who will turn out in November, there are at least two general approaches to estimating the composition of the likely voter population. The first is to look at the relationship between local trends and national trends, and project what will happen in Howard County based on national data. The second is to look at local trends only, and that’s the approach I take in this post. (I don’t have either the data or the time to look at national trends, so I’ll leave that to anyone else who might want to try their hand at it.)
The table below shows the relative proportion by party of voters in past general elections in Howard County, based on voter turnout figures maintained by the Maryland State Board of Elections.1 For example, the Democratic figure of 52.64% in 1988 indicates that in that year 52.64% of all people voting in the general election were registered Democrats. Note that this is not the same as the Democratic turnout, i.e., the percentage of registered Democrats who voted; for 1988 that figure was 83.81%.
| Year | % of Voters (D) | % of Voters (R) | % of Voters (Other) |
|---|---|---|---|
| 1988 | 52.64 | 35.27 | 12.10 |
| 1990 | 55.05 | 35.56 | 9.39 |
| 1992 | 50.16 | 35.86 | 13.98 |
| 1994 | 51.52 | 37.53 | 10.95 |
| 1996 | 49.60 | 37.09 | 13.31 |
| 1998 | 50.44 | 37.49 | 12.07 |
| 2000 | 48.58 | 36.54 | 14.88 |
| 2002 | 48.34 | 38.38 | 13.28 |
| 2004 | 47.75 | 35.37 | 16.87 |
| 2006 | 49.48 | 35.26 | 15.27 |
| 2008 | 50.08 | 31.73 | 18.19 |
One way to estimate voter share in 2010 is simply to look at the historical results and guesstimate. The following chart presents voter share by party in all of the general elections from 1988 through 2008 (from the above table), along with some added trend lines.
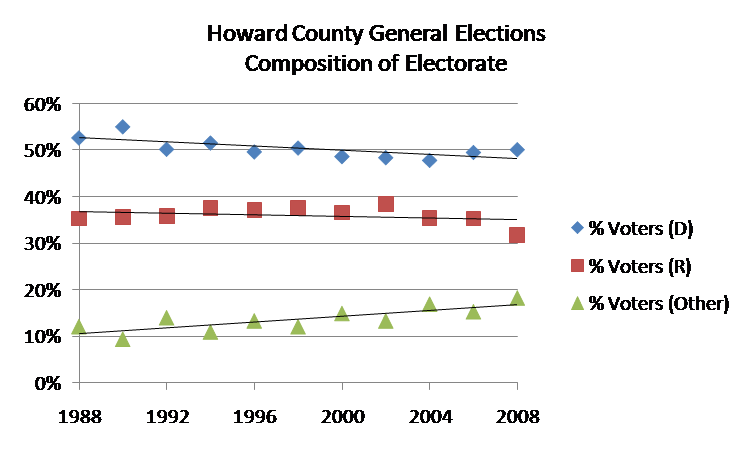
From the chart it appears that both the Democratic and Republican shares of those voting in Howard County general elections have been slowly declining (with Democratic share declining somewhat faster), and that the proportion of unaffiliated voters and others has been rising. Looking at this chart I’d estimate that the proportion of Democratic voters in the 2010 election would be somewhere around 47—48%, Republican share would be around 35—36%, and unaffiliated and other voters around 17—18%.
We can make a more formal estimate by doing a linear regression analysis, finding the lines that best fit the historical data and then projecting forward to 2010. (Linear regression is the mathematical technique that enables us to create trend lines like those in the above chart.) If we look at the data for all general elections, the estimated voter shares for 2010 are 47.5% Democratic, 35.0% Republican, and 17.3% unaffiliated and other.2
However these estimates have the obvious drawback that presidential election years (like 2008) show a different pattern of voter shares than gubernatorial election years (like 2006). (For example, the relative proportion of unaffiliated and other voters is consistently higher in presidential election years.) Therefore it may make sense to look only at the data for gubernatorial elections. If we do a linear regression on that data then the estimated voter shares for 2010 are 46.7% Democratic, 36.9% Republican, and 16.3% unaffiliated and other.3
The most interesting point from the regression analysis is that the proportion of unaffiliated and other voters in gubernatorial elections is an almost perfectly linear upward trend over time. (This is almost as true for the proportion of unaffiliated and other voters in presidential elections over time.) For whatever reason there appears to be a strong and consistent trend for unaffiliated voters to constitute a larger and larger proportion of voters in general elections.
Thus I feel reasonably confident in projecting that unaffiliated and other voters will constitute somewhere between 16 and 17% of all voters this November. Note that this estimate is consistent with the Yang poll (which had unaffiliated voters at 17% of the sample), but inconsistent with the Gonzales poll (for which unaffiliated voters were 14% of the sample).
On the other hand, the proportion of Republican voters in gubernatorial elections over time is not well-explained at all as a linear trend. Instead at first glance the proportion of Republicans appears to be bouncing around randomly in the general range of 35 to 39%. Given that, I find it somewhat implausible that the Republican share of voters this November would be as high as 40%, as assumed in the Gonzales poll. I’m more confident with a projection of 37%, which is a bit higher than the average of 36.8% in gubernatorial elections and a bit lower than the 37.53% Republican share of all voters in the 1994 election. Note that my projection of 37% is considerably higher than the 33% Republican share assumed in the Yang poll.
If I’m projecting a Republican share of 37% and an unaffiliated and other share of between 16 and 17%, that implies a projection of between 46 and 47% for the Democratic share of voters this November. This is a tad higher than the Gonzales assumption of 46% and significantly lower than the Yang assumption of 50%.
How might these proportions translate into actual votes for Ken Ulman vs. Trent Kittleman? I really don’t know how best to estimate that, and am not comfortable making a projection. However I will note that per my earlier post on Howard County “independent” voters, the projected 17% unaffiliated and other voters are almost certainly not all up for grabs. Instead many if not most of them are simply weak partisans who don’t want to formally affiliate with their party of preference. It’s therefore quite possible that unaffiliated voters will vote for Ulman and Kittleman in roughly the same proportions as one might expect from the Democratic and Republican shares of those voting on November 2.
UPDATE: For more on this general topic please see my follow-up post.
For the detailed figures see the general election turnout spreadsheet I prepared. I used figures from the Maryland State Board of Elections for 1988, 1990, 1992 (for all voters, the Democratic, Republican, Libertarian, and Alliance parties, and unaffiliated voters), 1994, 1996 (for all voters, the Democratic, Republican, Libertarian, Reform, Natural-Law, and Taxpayers parties, and unaffiliated voters), 1998, 2000 (for all voters, the Democratic, Republican, Libertarian, Reform, Green, and Constitution parties and unaffliated voters), 2002, 2004 (for all voters and broken down by party), 2006, and 2008. ↩︎
I did the linear regression analysis in the R environment using the lm() function. Using all data the best fit line for the Democratic voter share data had slope -0.2259 and intercept 501.6065 (with R-squared of 0.5094), the best fit line for the Republican data had slope -0.08736 and intercept 210.55982 (with R-squared of 0.1062), and for the unaffiliated and other data had slope 0.3130 and intercept -611.8021 (with R-squared of 0.6552). ↩︎
Using only the data for gubernatorial general election years, the best fit line for the Democratic voter share data had slope -0.358 and intercept 766.250 (with R-squared of 0.7777), the best fit line for the Republican data had slope -0.00625 and intercept 24.35650 (with R-squared of 0.000844), and for the unaffiliated and other data had slope 0.3522 and intercept -691.6035 (with R-squared of 0.9894). ↩︎