Recently the Mercatus Center at George Mason University released its latest “Freedom in the 50 States” index ranking US states by their overall levels of personal and economic freedom. I happened to see it via a post on the Bleeding Heart Libertarians blog, but it’s been referenced in a number of places. I won’t rehash the comments of others, many of which criticize the way the various types of freedom are measured. Rather I had a somewhat different question, namely whether the measures of freedom in this report, particularly those for economic freedom, actually tell us anything useful.
The blog post announcing the new edition of the index claims that “regulatory freedom in particular is associated with states‘ growth in personal income,” but that analysis is apparently part of the full book-length edition not yet released. In the meantime I’m interested in a separate question at the heart of the Bleeding Heart Libertarians project, namely whether increased economic freedom makes a positive difference to the poorest members of society, as BHLers suggest, or whether “economic freedom” is really just a code word for policies that benefit the rich at the expense of the poor, as many progressives suggest. The folks at the Mercatus Center were nice enough to release the data on which the rankings are based, so I can use that data to start exploring the question.
I should stop here and note that there are people far more competent than me to do this sort of analysis; however I think it’s important not to be intimidated by issues involving numbers and statistics, and I encourage others to take the same attitude. In support of my novice attempt I’ve created a Google spreadsheet containing the following variables of interest: the Mercatus Center values for economic freedom, fiscal freedom, and regulatory freedom for each of the 50 states in 2009 and 2011, and the percentage of people in each state participating in the Supplement Nutrition Assistance Program (“food stamps”) in December of 2009 and 2011.1
I’m choosing SNAP participation as a proxy for poverty because ensuring people have enough to eat would presumably be a goal of any social safety net, no matter how basic. I would include SNAP participation rates for 2007 as well, but my source for the SNAP data doesn’t have percentage figures for that year and I’m too lazy to do the calculations myself.
I’ll assume for the sake of argument that libertarians are correct, and that increased economic freedom should reduce the number of people poor enough that they need food stamps. This might occur in multiple ways: greater economic freedom could produce general prosperity that raises the prospects of the poor as well; some economic freedoms, such as the reduction or elimination of occupation licensing restrictions, could benefit poor people specifically; and greater economic freedom might reduce the extent to which government “crowds out” private initiatives, so that people get fed via charities or support from their extended families and have less need to apply for SNAP.
Now for the analysis of this hypothesis: If you want to follow along at home, download the R statistical package in your preferred version (for WIndows, Mac, or Linux) and install it, and then download my data in comma separated value (CSV) format suitable for loading into R. Start R, go to the directory where you downloaded the data file (in my case /Users/hecker/Downloads on my Mac), and load the data into the variable fs (a “data frame” in R-speak):
> setwd("/Users/hecker/Downloads")
> fs <- read.table("freedom-snap.csv", sep=",", header=TRUE)
> fs
state st econfree2009 regfree2009 fiscfree2009 snappct200912
1         Alabama AL      24.9388     -7.4383       32.377          16.8
2          Alaska AK      -4.8841      8.9700      -13.854          10.2
3         Arizona AZ      14.6838      9.5361        5.148          15.2
...
>
(The sep="," parameter tells R that this is a CSV file, and the header=TRUE parameter tells R to use the text fields in the first line of the file as names for the columns.)
As a first step in the analysis I’ll use the plot() function to plot the values of fs$snappct201112 (the percentage of the population in each state receiving food stamps in December 2011) against the values of fs$econfree2011 (the Mercatus economic freedom value for each state in 2011):
> plot(fs$econfree2011,fs$snappct201112)
>
R can generate very professional-looking plots but in this case I don’t need the frills, just the following simple but nonetheless useful scatter plot:

(If you’d like you can click on the graph to see a larger version.)
At least at first glance there doesn’t appear to be any relationship between the level of economic freedom in each state and the percentage of that state’s population poor enough to be using food stamps. But I have a powerful statistical package at my service, so I’ll do a little more work. In particular, I can compute the correlation coefficient between economic freedom and SNAP participation, a measure of how the two variables are linearly related:
> cor(fs$econfree2011,fs$snappct201112)
[1] 0.03106044
>
Perfect positive correlation would correspond to a correlation coefficient of 1.0; in that case SNAP participation, and thus presumably poverty, would directly increase as economic freedom increases. Perfect negative correlation would correspond to a correlation coefficient of -1.0; in that case SNAP participation, and thus presumably poverty, would directly decrease as economic freedom increases. But in this case the correlation coefficient at 0.031 is very close to zero, so my initial conclusion is that economic freedom, at least as measured by the Mercatus Center, doesn’t appear to make a difference either way.
What about if I measure the correlations with regulatory freedom and fiscal freedom respectively? Here are the results for those calculations:
> cor(fs$regfree2011,fs$snappct201112)
[1] -0.2284056
> cor(fs$fiscfree2011,fs$snappct201112)
[1] 0.1714178
>
Now I see some correlation, although it’s relatively weak: increased regulatory freedom is associated with slightly decreased SNAP participation (slightly less poverty), while increased fiscal freedom is associated with slightly increased SNAP participation (slightly more poverty). Since economic freedom is calculated as the sum of fiscal freedom and regulatory freedom, these effects (if they actually exist) cancel each other out when considering the effects of economic freedom as a whole.
Are the correlations with regulatory freedom and fiscal freedom really significant? There are statistical techniques that can address that question, but I’m not well-versed enough in statistics to do a good job of investigating it. Instead I can get a feel for how fuzzy these correlations are by creating scatter plots as I did with economic freedom above. This time I’ll get a little fancier and put real x and y axis labels on the graph, and use the two-letter state codes to label the points instead of using circles:
> plot(fs$regfree2011,fs$snappct201112,xlab="Regulatory Freedom (2011)",
+   ylab="SNAP Participation Percentage (Dec 2011)",pch=NA_integer_)
> text(fs$regfree2011,fs$snappct201112,labels=fs$st)
>
(The parameter pch=NA_integer_ causes the points to be initially plotted without any symbols displayed, and then the labels=fs$st parameter to the text() function causes the state codes to be plotted where the symbols would normally go.)
Here’s the resulting graph for SNAP participation percentages vs. regulatory freedom:
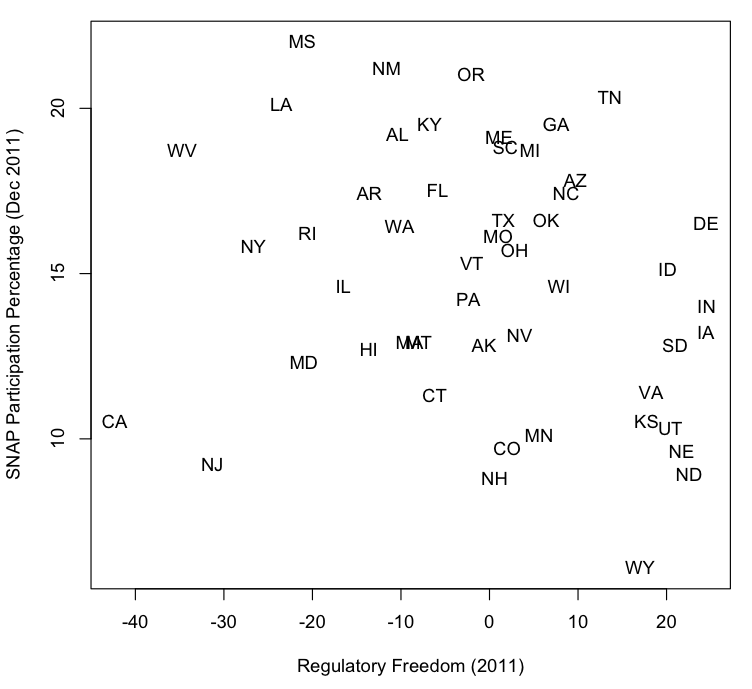
It looks as if there’s a slight tendency for states with greater regulatory freedom to have fewer people on food stamps, but still the data are all over the map in general.
I’ll do the same sort of graph for fiscal freedom:
> plot(fs$fiscfree2011,fs$snappct201112,xlab="Fiscal Freedom (2011)",
+   ylab="SNAP Participation Percentage (Dec 2011)",pch=NA_integer_)
> text(fs$fiscfree2011,fs$snappct201112,labels=fs$st)
>

Here any correlation is even harder to discern, though if I squint I can see a very slight tendency for states with greater fiscal freedom to have higher rates of SNAP participation.
I can also get a feel for how real these correlations are by looking at data for other years. In this case the only other data I have is for 2009; rather than plot it I’ll go straight to the correlation coefficients:
> cor(fs$econfree2009,fs$snappct200912)
[1] 0.02359412
> cor(fs$regfree2009,fs$snappct200912)
[1] -0.129513
> cor(fs$fiscfree2009,fs$snappct200912)
[1] 0.1000464
>
The correlations here are even smaller than those for 2011, at just over half the size. If I looked at the 2009 data first I’d be inclined to say that there’s almost no correlation at all between regulatory freedom and SNAP participation, and ditto for fiscal freedom. As before, the correlation of SNAP participation with economic freedom (the sum of the two other freedoms) is essentially zero.
To conclude, we have an index of economic freedom that was created through a fairly sophisticated process by an organization motivated to do a good job of it, given its goal to promote the benefits of free markets. And yet according to its own measures increasing the level of economic freedom in a given state seems to produce little if any improvement in the plight of the poor in that state, at least based on one plausible measure of poverty. On the other hand, progressives may be disconcerted as well: the sorts of policies advocated by free market think tanks under the banner of “economic freedom” don’t seem to be making poverty worse either.
Maybe I chose the wrong measure of poverty, or perhaps my amateur analysis is flawed in some other way. What’s the real story? Does economic freedom as measured by the Mercatus Center actually help the poor or not? I’ll leave the task of producing a final answer to that question to wiser heads than mine.
UPDATE: I replaced an incorrect image for the first scatter plot (SNAP participation vs. economic freedom for 2011) with the correct one.
UPDATE 2: I added the line to read the data into a data frame; for some reason this got garbled in the original post.
The values for economic freedom, regulatory freedom, and fiscal freedom in 2009 are from rows 239, 237, and 13 respectively and columns BB through CY inclusive in the 2007–2011 sheet in the “Freedom in the 50 States” data spreadsheet [XLS]; the values for 2011 are from the same rows, columns CZ through EW inclusive. (Note that the economic freedom values are calculated in the spreadsheet as the sum of the fiscal freedom and regulatory freedom values.)
The values for SNAP participation for 2009 are from the table “Supplemental Nutrition Assistance Program: Persons participating as share of the population” on page 4 of the December 2009 SNAP participation tables [PDF], part of the 2009 SNAP data published by the Food Research and Action Center. The corresponding values for 2011 are from the table ”Supplemental Nutrition Assistance Program: Share of population participating” on page 4 of the December 2011 SNAP participation tables [PDF], linked to from the 2011 and 2012 SNAP data page on the same site. ↩︎