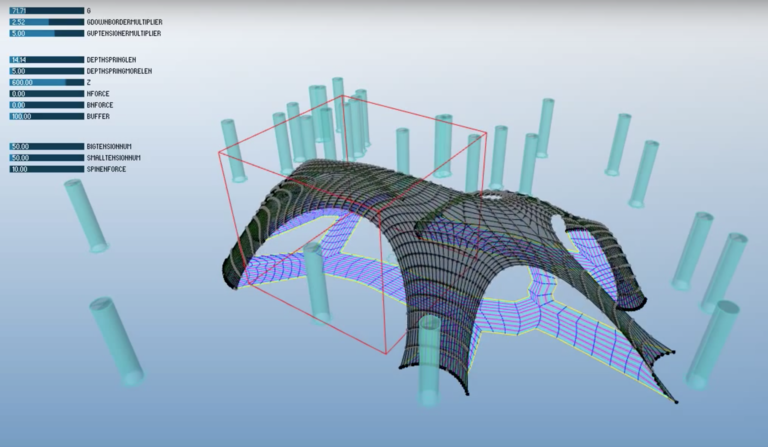
Snapshot of the “mesh inflation” process for the Chrysalis amphitheater shell. (Click to see the original video.) The original surface prior to inflation is outlined in yellow, with the lines of the mesh running “lengthwise” and “crosswise” shown in purple and blue respectively. Image © 2014 Marc Fornes; used with permission.
tl;dr: I explore the design of the Chrysalis amphitheater, the work of its designer Marc Fornes of THEVERYMANY, and the concepts underlying the design.
This article is one in a series exploring in depth the creation of the Chrysalis amphitheater in Merriweather Park at Symphony Woods in Columbia, Maryland. For the complete list of articles please see the introduction to the series.
The previous articles in this series focused on the history of Symphony Woods, the site of the Chrysalis amphitheater, and the overall design of Merriweather Park at Symphony Woods. With this article I finally turn to the Chrysalis amphitheater itself, the structure after which this series is named. In particular I discuss the concepts and techniques underlying the innovative way in which the form of the Chrysalis was designed, and explore the work of its designer, Marc Fornes of THEVERYMANY, in the years leading up to the creation of the Chrysalis. (Later articles will cover other aspects of the Chrysalis design and other members of the design team, including the work of Arup Group Limited and A. Zahner Company.)
This post is more technical than others in this series, because it’s difficult to get a sense for the significance of what Marc Fornes and his associates have achieved without delving a bit into the mathematics and programming techniques that make those achievements possible. I encourage you to check out the videos and interactive demos to which I link, and to lightly skim over sections if the going gets rough.

Apache wickiup in the Southwest US, photographed by Edward Curtis in 1903. (Click for a higher-resolution version.) Image from the Wikipedia article “Wigwam”; in the public domain.
Nonlinear beginnings
Marc Fornes is an architect using advanced computer techniques to create structures based on complex nonlinear forms. In a way his work, and that of others like him, represents a coming-together of two ancient ways of building.
The first, dating back to our hunter-gatherer ancestors and continued with nomadic and small-scale agricultural societies, is the long tradition of “folk architecture” built along natural and organic lines, including most notably tents and tent-like structures in their various forms: wigwams, wikiups, tipis, yurts, and so on. These structures were (and are) typically small scale (built as family residences), based on natural forms and materials (wood bent to shape, cloth under tension), constructed by small teams working quickly, and often explicitly intended as temporary (since a group might spend only a relatively short time in one place).
As such these structures were not “architected” in the sense of being based on detailed specifications created by an architect for use by those who build the structures—there was no real need to do so, since the “architect” and “builder” were one and the same (and often were the user of the structure as well). In any case the nonlinear form of the structures made it difficult to describe them using conventional architectural plans as we think of them today. Instead such structures were constructed using methods worked out by trial and error over many years and taught by one generation of builders to the next.
We can think of these methods, each producing a specific type of structure, as being algorithms—not algorithms that were written down but algorithms that were transmitted verbally and then executed by the builders to create each structure. The algorithms were not arbitrary, but were constrained by the type of material used and the general type of structure to be produced. The final form of the structure was then determined by the algorithm, the materials, and the interplay of forces of compression and tension acting on those materials as they happened to be arranged.
Leveraging the natural forms and properties of the underlying materials also produced structures that were optimized in terms of their use of materials, neither using too much material (and thus wasteful of effort) or too little material (and thus failing to fulfill their intended functions as shelter, etc.). The structures’ materials naturally assumed an organic form determined by the forces acting on them, and if additional forces (e.g., due to wind and weather) caused a structure to fail in certain places then builders learned how and where to use additional materials to reinforce the structure.
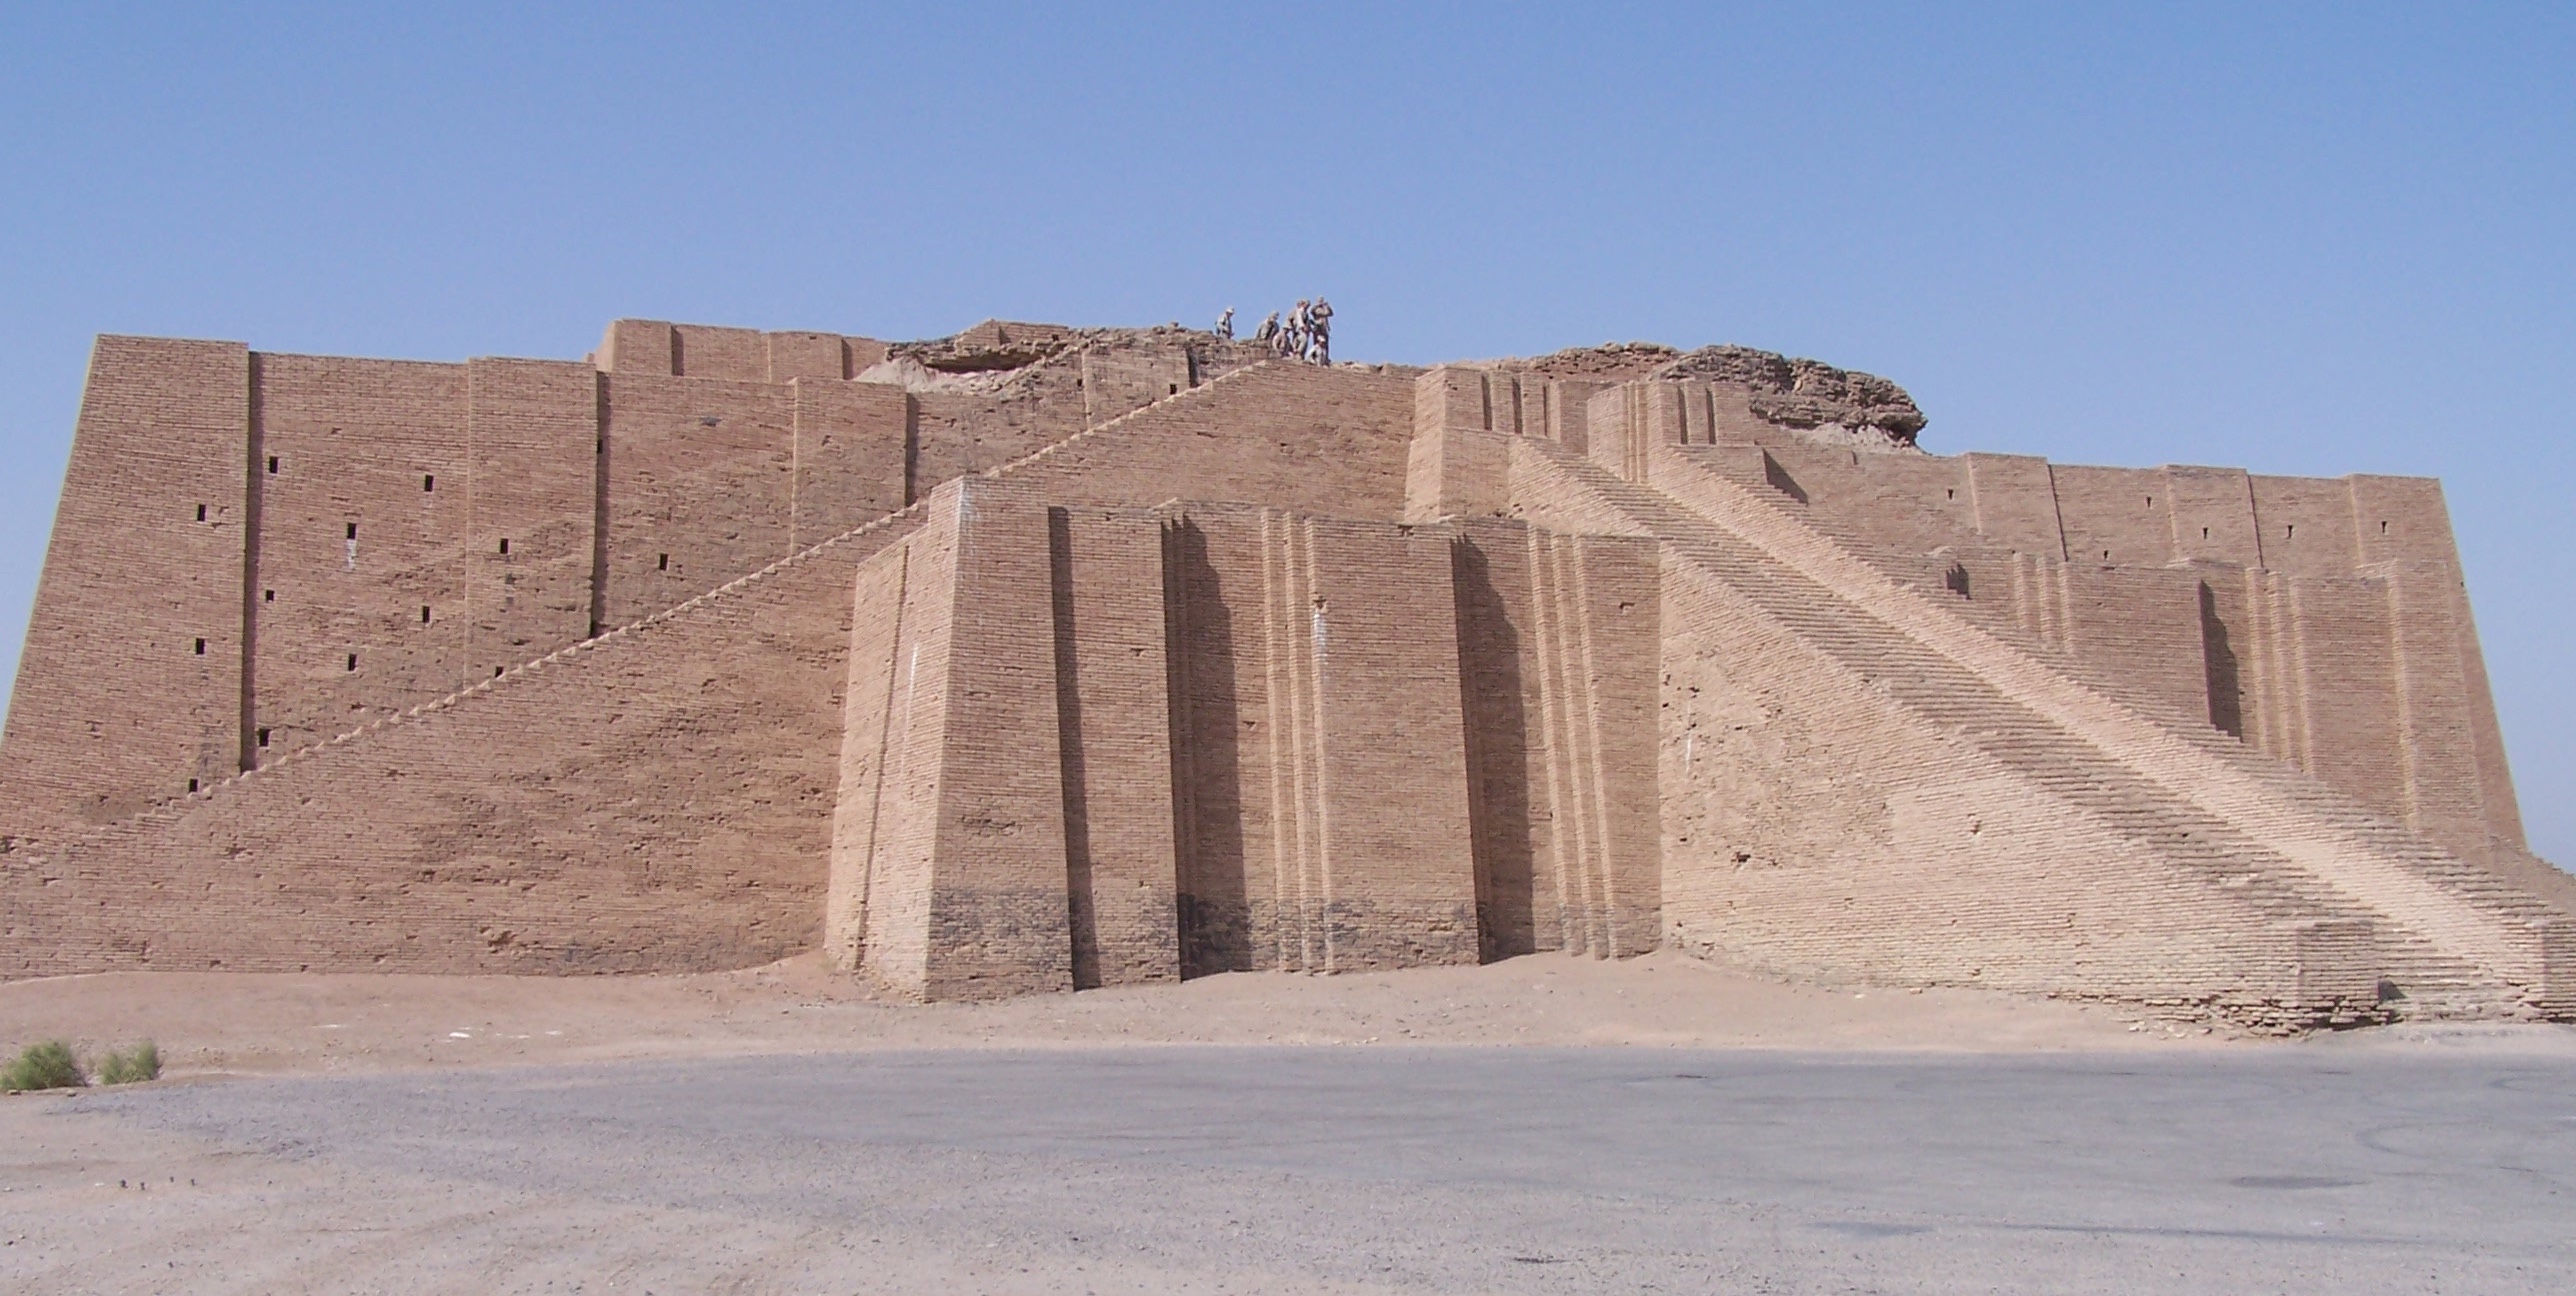
Reconstructed facade of the Neo-Sumerian Great Ziggurat of Ur, near Nasiriyah, Iraq. (Click for a higher-resolution version.) Image from the Wikipedia article “Ziggurat”; in the public domain.
Building blocks and linear thinking
Although hunter-gatherers, nomads, and small-scale farmers can be thought of as being informal architects, the way of building we most think of as “architectural” in character dates back several thousand years to the beginnings of large-scale hierarchical societies, when bricks and cut stone blocks began to be used in the construction of structures both small and large.
In particular bricks and blocks were ideal for constructing large-scale structures, since builders could leverage techniques of mass production: have a large work force create bricks or cut blocks in parallel, and then have a second work force assemble the bricks or blocks into finished structures.
However this meant that “master builders” needed some method by which workers could be instructed to lay the bricks or blocks in accordance with the builders’ mind’s-eye vision for the structure. This was especially important for large structures that might take multiple decades to build, long enough that the original master builders might be gone from the scene by the time the structures were completed.
In response to this need builders created the concepts students learn today in geometry class—straight lines, right angles, rectangles and triangles, and so on—to represent various architectural forms, along with simple but powerful tools to help workers embody those forms in physical structures—for example, plumb bobs to create vertical lines, or wooden triangles with sides in the proportion of 3 to 4 to 5 to create right angles.
These basic techniques to create various linear forms, along with additional techniques to allow construction of circular segments for arches and domes, served builders well for many centuries and became deeply embedded in the architectural and contruction practices of agricultural and (later) industrial societies. (The tale of the three little pigs and their respective houses captures this dynamic, promoting the superiority of linear forms constructed using solid materials over folk architecture using straw or sticks.)
Traditional wooden spline held in place by lead ducks. Image from “Interpolação Spline” by Tereza Godim; original source unknown.
Ducks, splines, and lofts
The use of arbitrary nonlinear forms in architecture was thus, for the most part, abandoned as societies became more complex and constructed larger and more elaborate structures. One major exception was in shipbuilding. Kingdoms, empires, and nation states creating large navies needed to construct large numbers of relatively identical ships, each of which required a relatively large construction force.
However the hulls of ships must be composed of streamlined curved forms that cannot be described in terms of linear or even circular segments, so naval architects needed to find other ways to define hull shapes in ways that could be reliably translated by ship builders to create the actual vessels.
One time-honored way in which this is done is to use flexible wooden strips (“splines”) in combination with multiple lead weights (“ducks”). The ducks are attached to a spline and force it to flex into a particular shape; the ducks are then moved around until an appropriate smooth curve is produced. The resulting curves are then followed in producing plans for the ship’s hull. Since the plans are full size (i.e., using a 1-1 scale) they need to be constructed in a large open space or loft, hence the name “lofting” for the overall process.
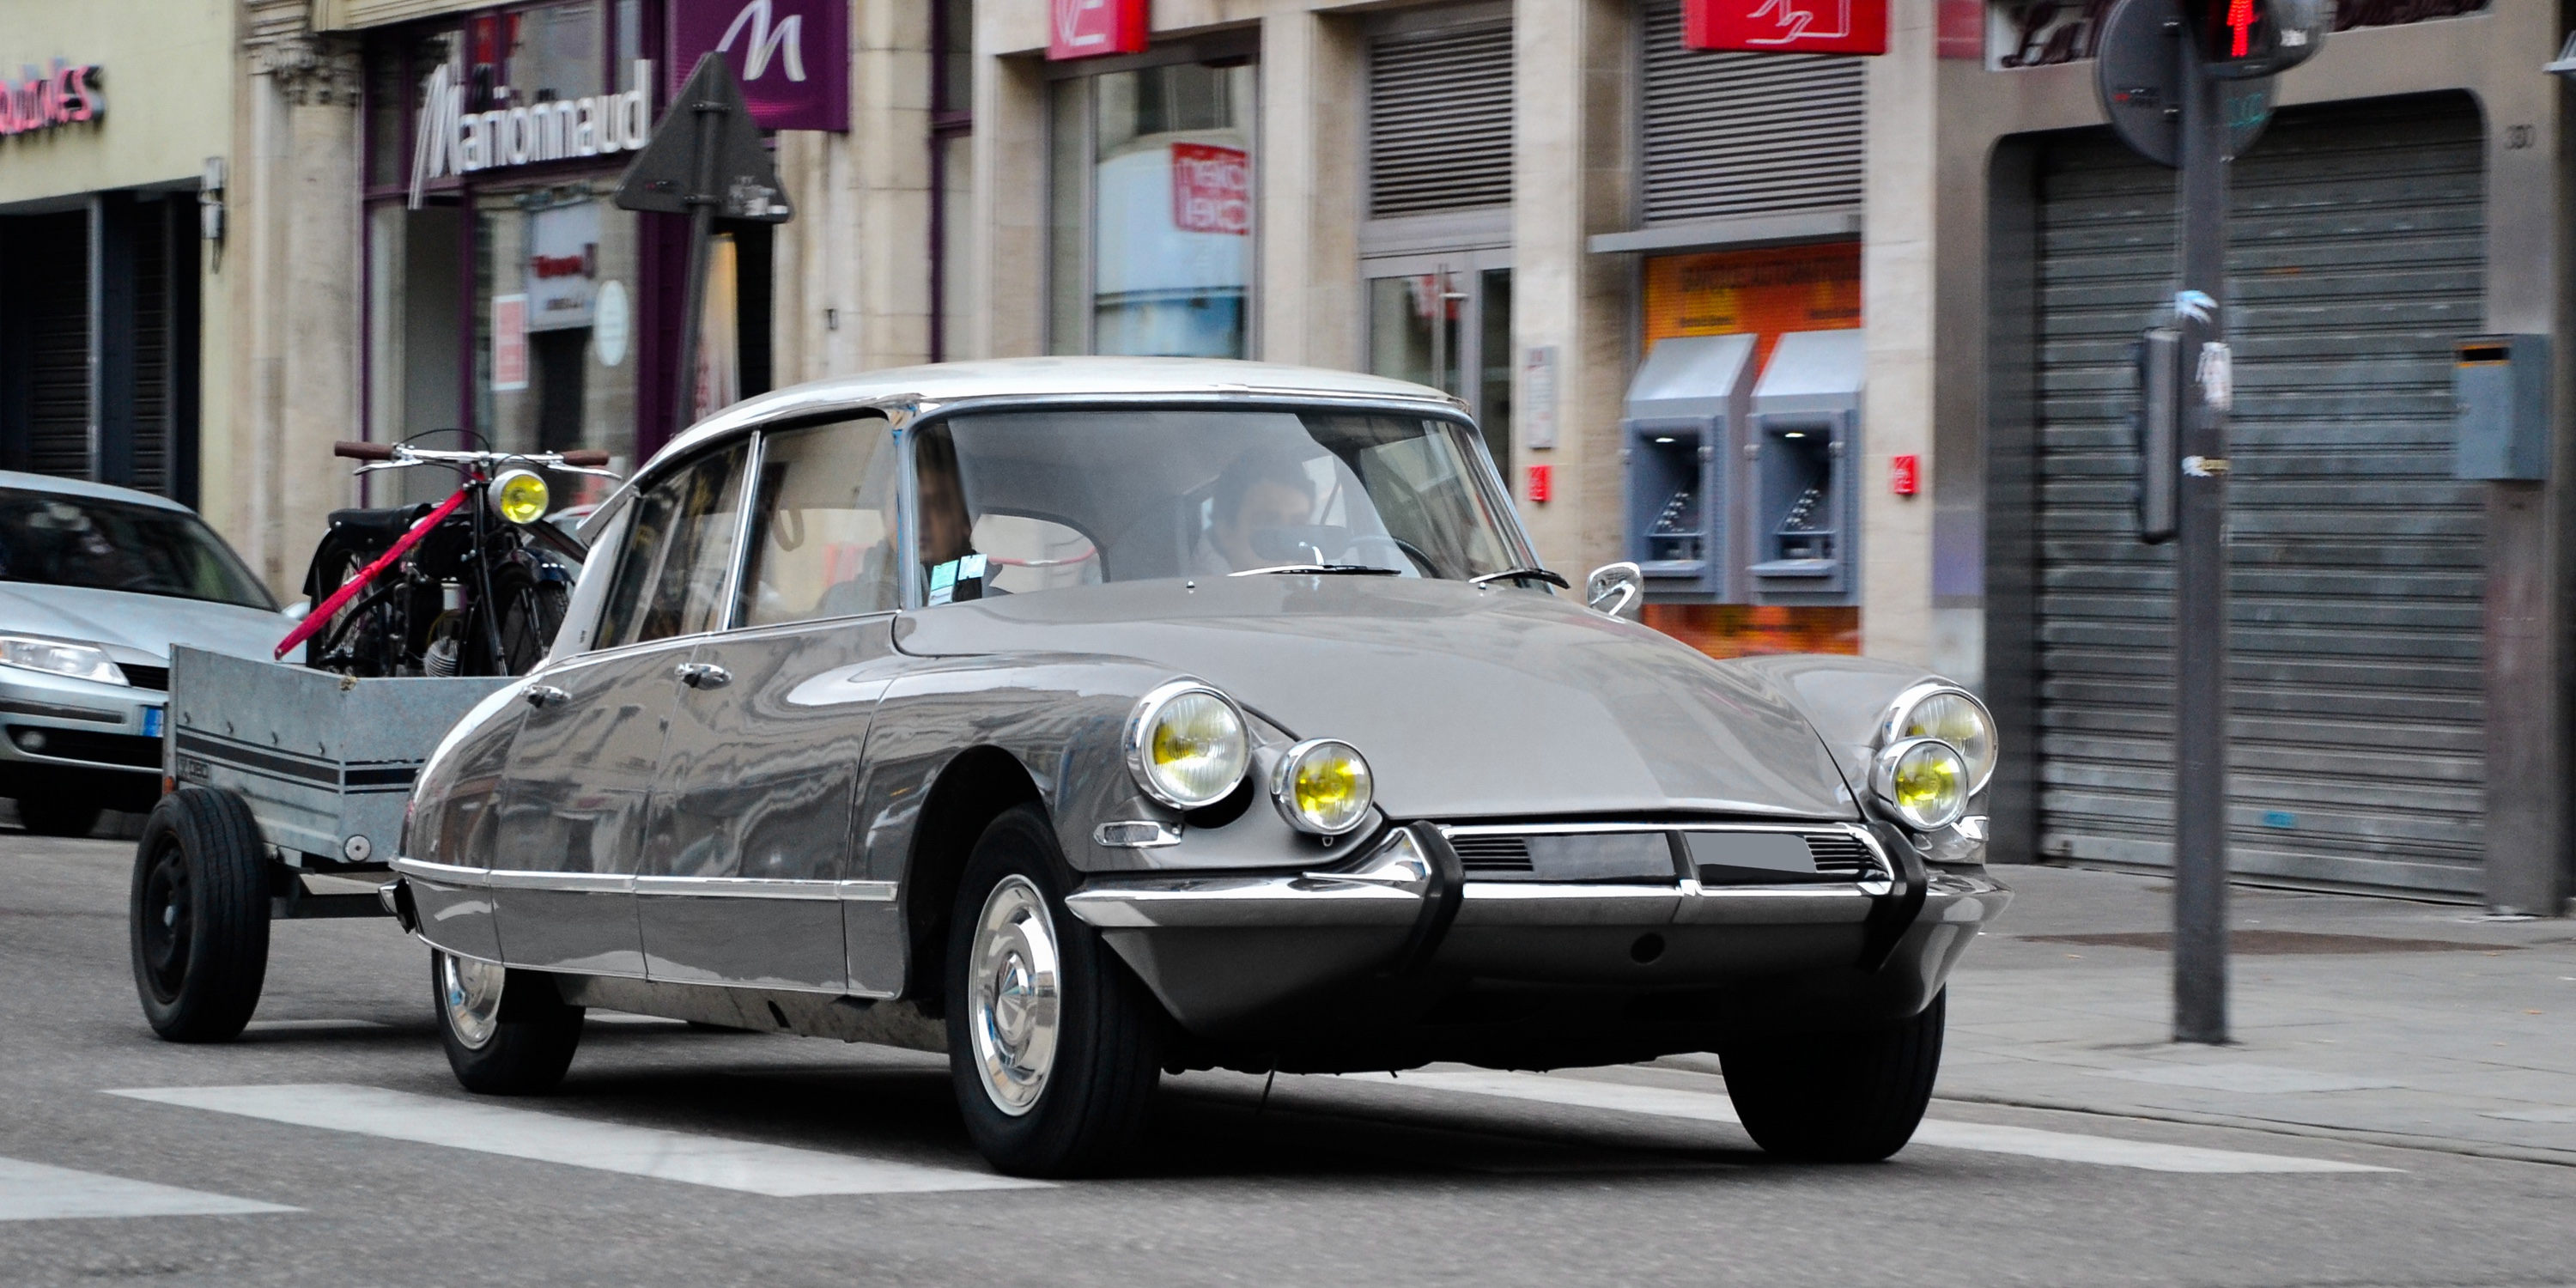
Citroën DS on the streets of Nancy, France. (Click for a higher-resolution version.) Image © 2013 Alexandre Prévot; used under the terms of the Creative Commons Attribution-ShareAlike 2.0 Generic license.
Mathematics to the rescue
Manual lofting continued to be used for ships well into the 20th century, and was later adapted for use in designing and constructing other streamlined forms, including airplanes and automobiles. However the process was very labor intensive and difficult to get right, so as electronic computers came into more widespread use after World War II automakers and aircraft manufacturers sought to enlist them in the design process, especially in conjunction with computer-driven machine tools that could take numeric instructions and create finished parts or molds.
At the same time traditional architecture was beginning to liberate itself from the constraints of linear forms, as the use of steel, reinforced concrete, and other new materials made it possible, at least in theory, to produce new types of structures that went beyond rectilinear and circular forms. But, as in designing ships, airplanes, and automobiles, it was easier to imagine new nonlinear forms than to describe them in detail sufficient to guide their construction—not to mention the problem of analyzing such structures to determine whether they would be structurally sound.
Using computers to create forms with complex curves and surfaces required finding compact mathematical ways to represent complex curves, programming computers to accurately and efficiently draw such curves, and (last but not least) making these techniques usable by people who didn’t have specialist mathematical or programming knowledge.
This was the challenge faced by Paul de Faget de Casteljau in 1959 when, fresh from earning a PhD in mathematics, he joined the French automaker Citroën. The recently-introduced Citroën DS model was acclaimed for the elegance of its curved unibody design, a form that was produced in a traditional way using clay and wood models. The models’ dimensions were then transferred to paper blueprints used in producing the body panels and related parts. All of these steps required painstaking manual work.
De Casteljau’s assigned task was to find a simpler way to represent the curves of an automobile’s body and parts, one that would be easier to use with the computer-controlled machine tools then coming into use at Citroën and elsewhere—a task made particularly urgent because while de Casteljau was working on the problem the wood modelers at Citroën went out on strike.
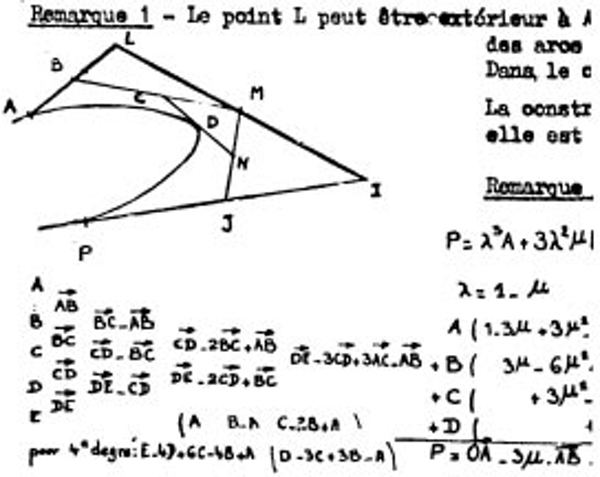
An example of a cubic Bézier curve calculated using de Casteljau’s algorithm, with control points A, L, I, and P as shown. A point D on the curve can be produced as follows: given a value between 0 and 1, find the points B, M, and J that are located at that fraction of the total length on the line segments AL, LI, and IP respectively. Then find the points C and N that are located at that fraction of the length on the line segments BM and MJ respectively. Finally, find the point D located at that fraction of the length on the line segment CN. Image © 1963 Automobiles Citroën, from the technical report “Courbes et surfaces à pôles” by Paul de Casteljau (as excerpted in “A History of Curves and Surfaces in CAGD),” by Gerald Farin).
From points to curves
De Casteljau found a way to represent curves using a fixed set of mathematical expressions (known as Bernstein polynomials1) in combination with a set of variable control points (see the figure above), each having horizontal (x) and vertical (y) values jointly specifying its position.
For example, if four control points are to be used then we start with the standard set of four Bernstein polynomials. The four control points can then be placed anywhere on the flat surface on which the curve is to be drawn (i.e., they can have arbitrary x and y values); each control point is associated in turn with one of the four Bernstein polynomials being used.
The problem of drawing a curve is then reduced to the following procedure, which can be thought of as occurring over an interval of time running from zero to one (e.g., from zero to one minute):
Start at the initial value of time (t = 0), evaluate the given mathematical expressions (the Bernstein polynomials) for that time value, and use the resulting values in conjunction with the control points’ x and y values to derive the position for the first point on the curve.2
Advance the time by a small increment, recompute the Bernstein polynomials for that new time value t, and again use the resulting values in conjunction with the control points to derive the position for the next point on the curve.
Repeat step 2 until you arrive at the final value of time (t = 1), at which point the final point on the curve is derived and the curve is complete.
The number of control points used determines the type of mathematical expressions used and the type of curves that can be drawn: using two points produces a line segment, using three points produces a segment of a parabola (the type of curve produced by a ball thrown into the air), using four points produces a cubic curve (so-called because the underlying parameter is multiplied by itself and then multiplied by itself again, as is done in computing the volume of a cube), and so on.
Because of the way the Bernstein polynomials are defined and associated with the control points, the curve produced is guaranteed to start at the first control point, to end at the last control point, and to pass (relatively) close to each intermediate control point. Changing the shape of the curve, or its starting and ending points, can be done by moving the positions of the control points (analogous to moving the ducks attached to a traditional spline). More complicated curves can be created by using more control points (analogous to adding more ducks) and correspondingly more complicated mathematical expressions (Bernstein polynomials of higher degree).
Note that this is not the only way to draw such curves. In particular, de Casteljau invented an elegant way to find points on a given curve using a geometric process involving lines between the control points. (See the figure above for a more in-depth explanation.) What is now known as the de Casteljau algorithm is mathematically equivalent to computing curve points using the Bernstein polynomials.
De Casteljau’s work saw immediate application at Citroën in the early 1960s, and was considered so important that Citroën treated its mathematical foundations as a trade secret for many years. However in the meantime engineers at rival French automaker Renault heard rumors about what was happening at Citroën and set out to implement a similar system.
Renault engineer Pierre Bézier independently discovered a representation for complex curves later shown to be mathematically equivalent to that of de Casteljau. Bézier’s associate Daniel Vernet independently invented de Casteljau’s geometric algorithm. Bézier, Vernet, and others at Renault then used these techniques to develop UNISURF, one of the first widely-used computer programs for what came to be known as computer aided design or CAD.
Unlike Citroën, Renault took a more relaxed attitude towards publicizing the technical achievements of its employees, and allowed Bézier and Vernet to publish various papers about their work in the late 1960s and early 1970s. Bézier also promoted Renault’s accomplishments in personal visits to other CAD researchers in academia and industry. As a result curves created using Bernstein polynomials are now universally known as Bézier curves.3
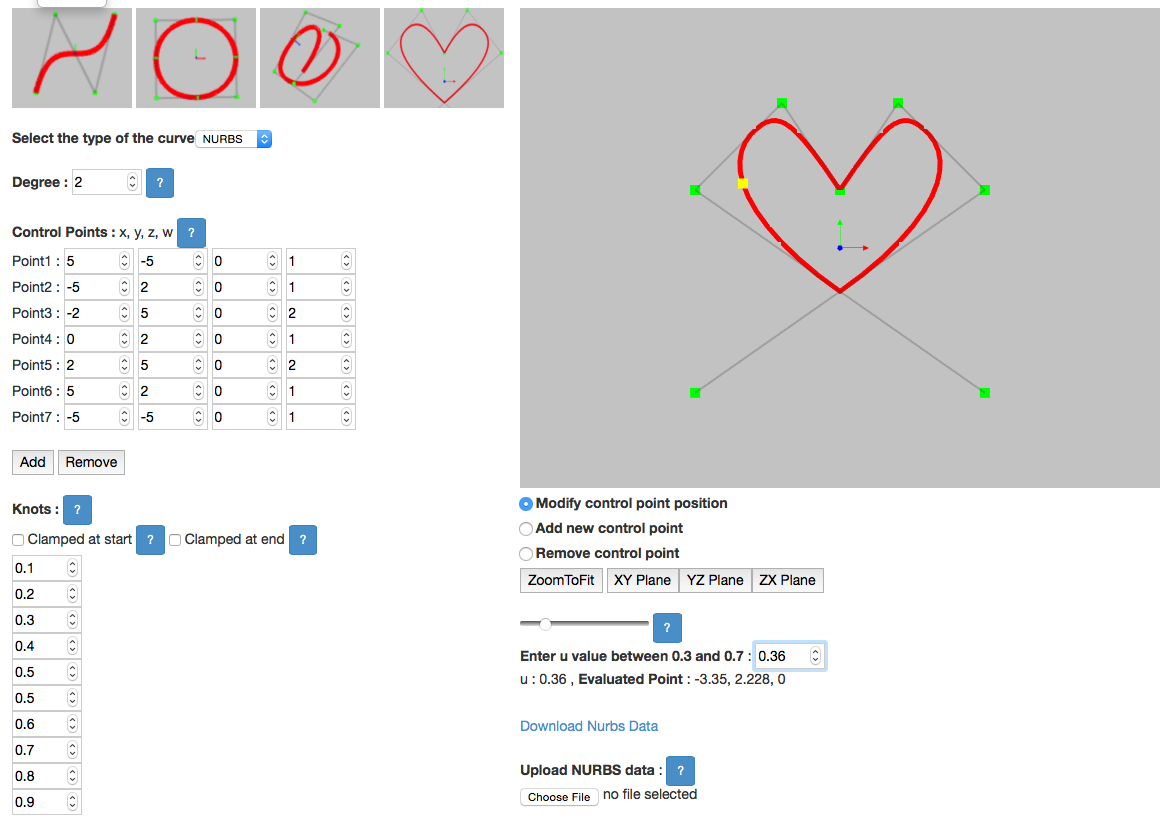
An example of a NURBS curve of order 3 (degree 2), with seven control points (in green, with values at the upper left) and ten knot values (at the lower left). (Click for a higher-resolution version.) Point3 and Point5 have twice the weight of the other points (see the w values in the list of control points), so that the curve passes more closely to them. Also, the value 0.5 is repeated twice in the list of knots, so that the curve has a kink at Point4. The curve is thus a true example of a non-uniform rational b-spline: non-uniform because the knots are not all evenly spaced, and rational because the control points’ weights are not all one. Screenshot taken from the NURBS-Calculator interactive demo, © 2016 pawangami@gmail.com.
Beyond Bézier
The invention of Bézier curves and their application in engineering marked the beginning of the discipline of CAD (also known as computer aided geometric design or CAGD), and the 1960s and 1970s saw a steady flow of improvements and refinements of the work done at Citroën, Renault, and elsewhere.
Designing real-world artifacts required ways to generate surfaces (not just curves), as well as ways to generate more complicated curves than could be represented using simple Beziér curves. Let us first focus on the issue of generating more complex curves, and look at two ways to create such curves using Bézier curves.
The first approach is simply to use more control points (corresponding to higher-degree Bernstein polynomials). The problem with this approach is that in a Bézier curve each of the control points has at least some influence over essentially all of the curve. This makes it difficult to tweak a Bézier curve to match a pre-defined idea of what the curve should look like: if you move one of the control points in an effort to make a change in one portion of the curve, that movement will end up affecting other portions of the curve that you don’t want to change.
A second way to create a more complex curve is to build it out of multiple Bézier curves joined end to end. The problem with this approach is that it is difficult to get the resulting composite curve to smoothly transition from one of the underlying Bézier curves to the next, as is required in applications like auto body design.4
Greater smoothness can be obtained by constraining the control points of one of the underlying Bézier curves relative to the control points of the previous or next curve, but for reasons mentioned above this can lead to difficulties when trying to tweak the shape of the overall curve in certain places.
The solution to this problem was to replace Bernstein polynomials with more general functions known as basis splines. In mathematics “splines” are functions pieced together out of multiple polynomial expressions, with each expression being non-zero only on a particular interval. They are named by analogy to traditional wooden splines, since the expressions and their associated intervals are chosen such that the curve produced by the function flows smoothly from one interval to the next.
“Basis splines” or B-splines form a special set of spline functions that can be combined to represent any spline function created using polynomial expressions of the same level of complexity, or order.5
A fixed set of B-spline functions is then combined with a set of variable control points to draw a curve, similar to what was described above for Bernstein polynomials and Bézier curves. The underlying parameter used in the B-spline functions goes from some minimum value to some maximum value. Unlike Bézier curves the minimum value may be different than zero, and the maximum value different than one.
A set of numbers known as knots then defines a set of intervals for the parameter between its minimum and maximum values. If the knots are chosen appropriately then a particular B-spline function will have non-zero values only on a few adjacent intervals, and will be zero on all other intervals.
When the B-spline function associated with a given control point has non-zero values only on certain intervals of the underlying parameter, moving that control point affects only the parts of the curve drawn over those intervals. This addresses the first deficiency of Bézier curves discussed above.
The second concern (smoothness of the curve between the intervals) is addressed by the mathematical definition of the B-spline functions: their shape is such that their influence (and thus the influence of their associated control points) tails off smoothly at the beginning and/or end of the intervals for which they are non-zero.
By varying the knot values the curve can be constrained and shaped in various ways. For example, setting multiple knot values to be the same at the beginning of the knot series can be used to constrain the curve to start at the first control point, while setting multiple knot values to be the same at the end of the knot series can be used to constrain the curve to end at the last control point. The curve also varies depending on whether the knot values are evenly spaced (uniform) or otherwise (non-uniform). For example, setting multiple knot values equal to each other in the middle of the knot series can be used to produce kinks in the resulting curve.
Finally, the control points themselves can be given differing weights when combined with their B-spline functions. A control point with a higher weight will have a greater influence on the curve, so that the curve will pass closer to the control point in question. Another control point may have a lower weight and thus only a fraction of the influence of other control points, so that the curve passes relatively further away from the point. Another word for fraction is ratio, and thus B-splines with differing control point weights are known as rational B-splines.
In the most general case the knot values are non-uniform, and the control points have different weights. The resulting curve is referred to as a non-uniform rational B-spline curve, or a NURBS curve for short.

A NURBS surface showing the grid of control points (L) and how the underlying parameters u and v are varied from their minimum to their maximum values in computing points on the surface (R). (Click for a higher-resolution version.) Image © 2017 Autodesk, from The Dynamo Primer; used under the terms of the Apache open source license.
From curves to surfaces
The mathematical formalisms underlying practical applications of NURBS curves were worked out in the 1960s and 1970s. Among other things, it was discovered that Bézier curves are just a special case of NURBS curves. It also turned out that NURBS curves could be used to represent conic sections, that is, curves like circles and ellipses formed by slicing a plane through a cone. NURBS curves thus became a universal standard for representing 2-dimensional curves of almost any type.
What about 3-dimensional curves and surfaces? Extending NURBS curves into three dimensions is very simple: just use control points with three coordinates instead of two (in mathematical terms, adding a z value to the previous x and y values). Creating 3D surfaces from NURBS curves is somewhat more complicated.
One way to do it is to use a grid of (3-dimensional) control points (and associated weights), two different parameters (instead of the one parameter used for a NURBS curve), two sets of B-spline functions (which can be of different orders), and two sets of knots.
One set of B-spline functions and knots is used with the first parameter (u) and the x-y-z coordinates of the control points running in one direction on the grid, with the second set of B-spline functions and knots then used with the second parameter (v) and the coordinates of the control points running in the other direction on the grid. A point on the surface is then computed for a given pair of parameter values u and v, using an expression that involves both sets of B-spline functions and both sets of knots along with the control point coordinates.
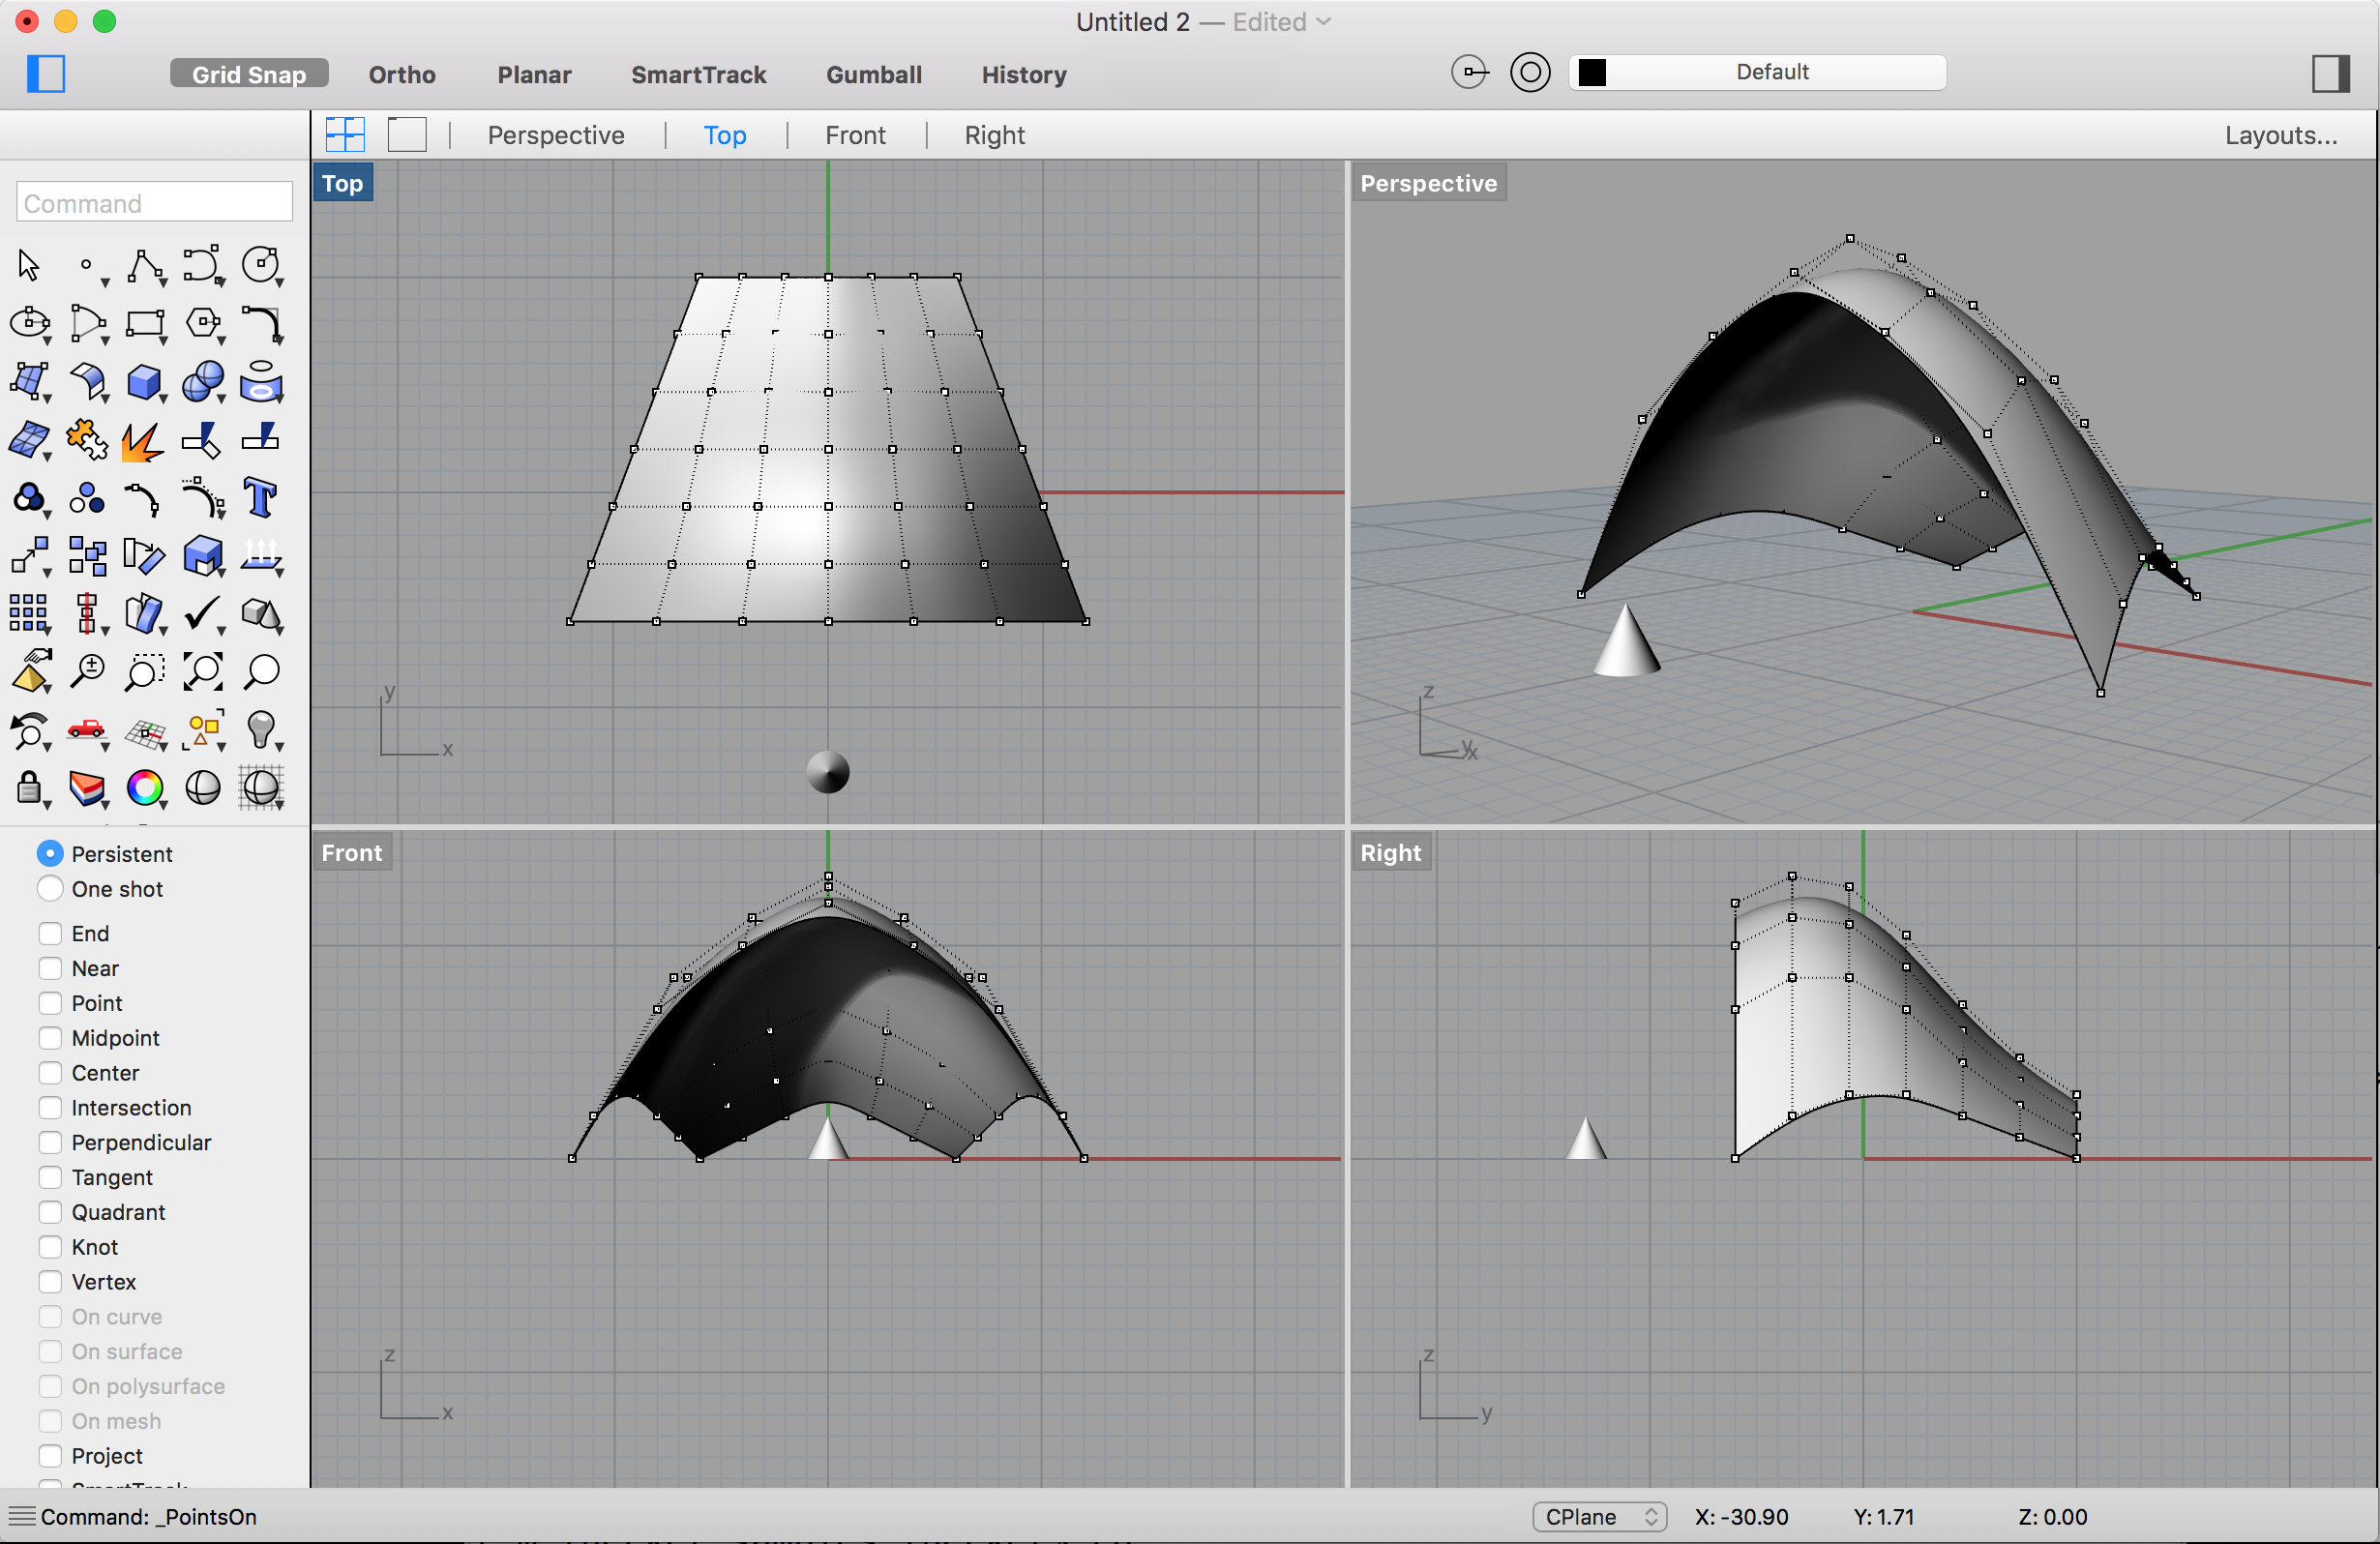
An example of using the Rhino modeling software to create a NURBS surface from four edges, each of which is a NURBS curve of order 4 with seven control points (shown) and nine knots. (Strictly speaking there should be eleven knots, but Rhino uses an optimization technique that eliminates two superfluous knots.) (Click for a higher-resolution version.) The geometry was created by less than 50 lines of code in the Python programming language. Rhino 5 for Mac software © 2016 Robert McNeel & Associates. Python script © 2016 Frank Hecker; published under the terms of the MIT open source license.
Computer aided design
In practice designers creating NURBS curves and surfaces are not concerned with the detailed mathematical computations underlying these objects. Instead they create curves and surfaces using special CAD software products that abstract away as much of the underlying mathematical complexity as possible, and provide relatively intuitive interfaces to define the curves and surfaces.
For example, using CAD software a designer can create a NURBS curve by explicitly placing control points and defining knot values and weights, or they can draw a curve freehand and then have the software determine the control points, knots, and weights needed to approximate the freehand curve. In either case a designer can further tweak a curve as needed, for example by dragging control points to new positions, deleting existing control points or adding new ones, changing knots and weights, and so on.
Once NURBS curves are defined they can then be used to create NURBS surfaces. For example, if four NURBS curves are connected together to form a four-sided shape, the software can use the four edges to interpolate a four-sided NURBS surface between. (See the figure above.) Multiple such surfaces can then be patched together to form a larger surface.
The earliest major CAD programs were developed internally at major automotive and aerospace companies. They include Renault’s UNISURF as well as similar software created at General Motors and elsewhere. It was no coincidence that these companies also employed many of the researchers working on NURBS curves and surfaces and related techniques, and also collaborated with academic researchers in the same area.
One such program worth noting is CATIA, originally developed in the 1970s by the French aircraft manufacturer Avions Marcel Dassault. Instead of keeping CATIA in-house, Dassault turned it into a commercial product and sold it to other aerospace companies (including Boeing), automotive companies, and others.
In the 1990s the architect Frank Gehry (co-designer of Merriweather Post Pavilion) and his firm adopted CATIA for use in designing his breakthrough commission, the Guggenheim Museum in Bilbao, Spain (completed in 1997), and subsequent high-profile projects. Among these were the Experience Music Project in Seattle (completed in 2000) and the Walt Disney Concert Hall in Los Angeles (completed in 2003).
(The EMP in particular was one of the first major collaborations between Gehry and A. Zahner Company, another member of the Chrysalis design team, which fabricated the building’s skin. Zahner’s work on the Chrysalis will be discussed in a future article in this series.)
Gehry’s success produced a lot of excitement about the possibility of using advanced nonlinear forms in architecture. However there were at least two factors that limited the adoption of CATIA and similar software by architects and made the impact of CAD software on architectural practice less revolutionary than it might otherwise have been.
First, CATIA and similar products and the computers needed to run them were very expensive: just the hardware alone for the Guggenheim Bilbao project was over half a million dollars at 1990s prices. (Gehry could afford it only because IBM loaned him the necessary graphics workstations.) Even today a full installation of CATIA or similar high-end CAD software can cost several thousand dollars per “seat,” that is, for each person using the product. Thus only the largest architectural firms could afford to employ such advanced technology.
Second, CAD software was primarily used as an adjunct to traditional architectural drafting and modeling techniques. Gehry himself boasted of his inability to use a computer. Instead he created designs like the Guggenheim Bilbao by first modeling them in paper or cardboard. He then handed them off to more junior architects to create more refined models to be digitized and imported into CATIA for final refinement and generation of the actual instructions for builders and fabricators. (These are not necessarily paper blueprints. Instead the models are typically translated into instructions for computer-controlled tools.)
Thus although Guggenheim Bilbao and similar projects offered a glimpse of a new way of doing architecture, fully realizing that new way would await a new generation of powerful but low-cost hardware and software, and a new generation of architects, “digital natives” prepared to fully exploit the possibilities inherent in these new technologies.
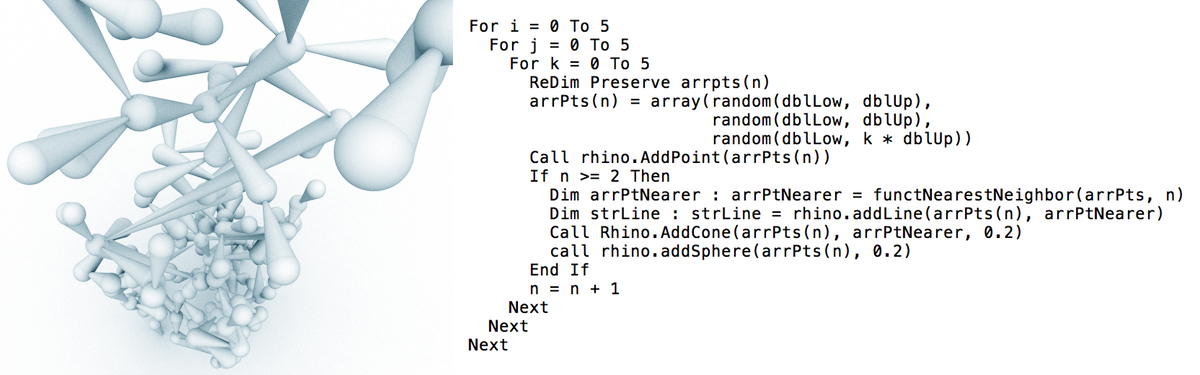
An simple form-finding example by Marc Fornes using the Rhino 3D modeling program and the RhinoScript programming language. The script (the core code of which is shown) generates over a hundred random points within a tall rectangular box. For each new point the script finds the nearest neighboring point and draws a cone with its base at the new point and its tip at the neighboring point, and then a sphere centered at the new point. Image and script © 2007 Marc Fornes; used with permission.
Form finding
The road that led to Marc Fornes’s work on the Chrysalis began in the early years of the 21st century, as the trends bringing faster, cheaper, and easier-to-use software and hardware gathered momentum. Fornes studied as an architect in France and then at the Architectural Association Design Research Lab in London, graduating in January 2004 with a Masters in Architecture and Urbanism.
After graduating from the DRL Fornes joined Zaha Hadid Architects in London, where he worked for over two years on a project to design a “médiathèque” (media library) for the French city of Pau, including an innovative self-supported roof constructed from a carbon fiber composite material. Although the Pau médiathèque project was ultimately cancelled for political reasons, much to the frustration of Fornes and his colleagues, it sparked his interest in complex curved surfaces and led him to begin experimenting with computational methods to design such surfaces.
That experimentation continued as Fornes moved to New York in the fall of 2006. Working under the project name “THEVERYMANY,” Fornes took advantage of multiple technological advances, of which the most important was the creation of the PC-based 3D modeling software Rhinoceros, popularly known as Rhino or Rhino 3D.
Rhino was created by Robert McNeel & Associates (“McNeel”), a Seattle-based company that was founded in 1980 as an accounting firm and spent most of the 1980s and 1990s as a reseller of the CAD product AutoCAD and a marketer of AutoCAD add-on software. Eventually McNeel developed and sold Rhino as its own Windows-based 3D modeling product, with version 1.0 released in 1998.
McNeel followed several business practices unusual for traditional vendors of proprietary CAD software, practices more akin to those of then-new Internet companies like Netscape or developers of free and open source software: McNeel not only priced Rhino at a level affordable to small companies, including “boutique” architectural firms and individual architects, it allowed liberal downloads of evaluation copies at no charge. McNeel also followed the open source dictum “release early, release often” and distributed “beta” copies of new versions in development almost as soon as the previous versions were released, soliciting ideas for new features from its customers.
As a result Rhino quickly acquired an installed base of over a hundred thousand users, and (among other things) became the tool of choice for an emerging community of experimental architects and designers, including Marc Fornes. That community in particular explored the possibilities opened up by one key feature of Rhino, namely its ability to be driven by a computer program rather than by a human designer.
Each operation executed through Rhino’s graphical user interface has an equivalent operation invoked by a textual command. Rhino supported the ability first to group multiple such commands together to execute a sequence of operations, and then provided full programmability using a scripting language (RhinoScript) and an associated application programming interface (API).6
Beginning in the mid-2000s Fornes and others pioneered techniques for form finding, that is, using the computer to generate potential structural forms from scratch, instead of using it simply as a way to digitally instantiate forms originally created by hand. They proselytized this new way of working through traditional in-person workshops and conferences as well as via the new medium of Internet blogs, including Fornes’s own blog theverymany.net.
Fornes conceived of this work as experimental: starting with certain premises, assuming certain constraints, and then finding ways to create designs within those constraints. The designs were created using “very clear protocols, sets of mathematical relationships, algorithms, [and] geometrical transformations” (in other words, what Fornes referred to as an “explicit” way of working), which in turn were instantiated (or “encoded,” as Fornes put it) in text files written in a particular computer programming language.
These designs also featured what Fornes referred to as “precise indetermination”. “Precise” meant that the programs made little or no use of randomness (the example in the figure above is a rare exception) and thus produced consistently reproducible output from run to run (especially important for fabrication of the resulting design). However the designs were also “indeterminate,” because the inherent complexity of the programs (including the interaction between different subprograms and their algorithms “fighting against each other”) made it difficult for the designer to predict ahead of time exactly how a design would turn out.
At first Fornes’s experiments were in digital form only, and in most cases they bore little resemblance to real-life structures. (See for example the above figure.) Many resembled nothing so much as exercises in advanced mathematics, which in a sense they were.
Following on from the original academic and industry researchers who created the mathematics and associated algorithms for NURBS curves and surfaces, Fornes and others used software like Rhino to play with the application of mathematical concepts to design: recursive definitions of surfaces and solids, fractals and L-systems, cellular automata, vector fields, Voronoi tesselations and Delaunay triangulations, and so on.7 Fornes’s blog posts in 2006 and 2007 document this work, typically pairing striking images with the RhinoScript code or pseudocode that produced them.
Fornes also combined his day-to-day work as an architect with an increasingly heavy schedule of academic work at Columbia University in New York, the University of Southern California in Los Angeles, die Angewandte (the University of Applied Arts) in Vienna, and elsewhere, as well as instructional classes in RhinoScript programming for McNeel and related activities at workshops, conferences, and exhibitions.
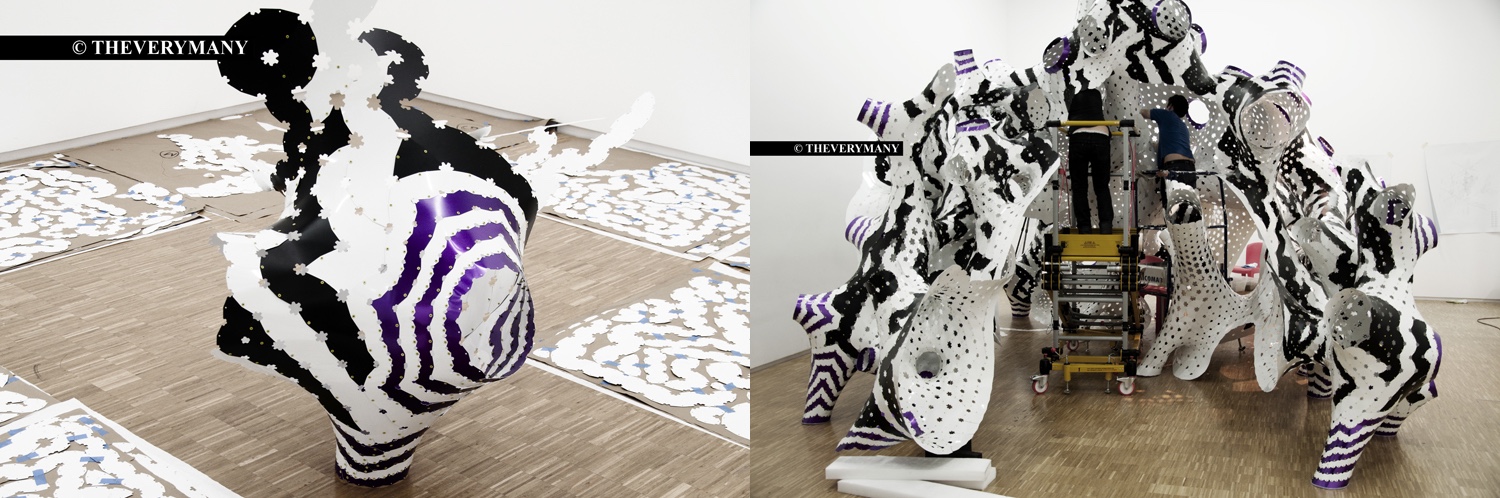
Two stages in the assembly of Y/Surf/Struc (part of the permanent collection of the Centre Pompidou in Paris): an assembled module of the structure surrounded by cut strips of aluminum sheet to be riveted together to form other modules (L), and the assembly team connecting the modules to form the final structure (R). (Click for a higher-resolution version.) The striped effect is produced by some aluminum strips being painted on one or both sides. Images © 2011 Marc Fornes; used with permission.
Iterative improvement
Although the designs produced by Marc Fornes and others could be viewed as striking works of art, Fornes conceived of himself not as an artist but as an architect, someone whose designs were actually built, or at least buildable.
Thus beginning in 2008 Fornes and his associates in THEVERYMANY began work on a series of what he called “prototypical structures”: structures not intended for permanent use by actual inhabitants, but rather created to explore various design techniques and methods for fabrication and assembly. Fornes and his team both designed the structures and assembled them, thus echoing the ancient tradition of folk architecture based on nonlinear forms, in which the roles of the “architects” and the “builders” were blurred.
In creating these prototypical structures Fornes and his associates also adopted an approach reminiscent of both traditional architecture and the Silicon Valley dictum “fail fast, fail often”. (Fornes hyberbolically referred to several of these projects as “big-time failure[s].”) Any problems encountered in creating the structures were treated not as fatal errors but as opportunities to learn what went wrong and fix it for the next iteration.
One of the first problems that presented itself was translating the curved surfaces of the design into flat elements that could be fabricated (e.g., in sheet plastic or aluminum) and then assembled. Because at the time there was no automated way to do this for arbitrary elements, Fornes created ways to design surfaces that both provided for three-dimensionality (necessary to create self-supporting structures) and also were composed of a relatively small number of unique regular elements that could be relatively easily arrayed on a sheet of material and then cut out and riveted together.
But even though the parts were relatively easy to fabricate, assembling them into an actual structure proved very difficult, requiring constant referral to the original digitally-rendered design in order to determine which elements attached to which others. In the end Fornes and his team were never able to complete the assembly of one such structure—although as it turned out the gallery for which it was intended had never seen the correct rendering, liked the structure as is, and even invited them to create another one.
In order to reduce assembly time Fornes and his associates adopted the practice of tagging the individual fabricated elements with encoded information regarding the other elements to which they connected. This reduced the need to refer back to the digital model and decreased assembly time by an order of magnitude.
Still other problems soon presented themselves. In scaling up to larger structures Fornes used thicker materials for the structural elements. This caused the weights of the structures to increase, which in turn made it more difficult for the structures to bear their own “dead load” and stand up by themselves. Because all elements of the structures had to be riveted to each other using pre-made holes, Fornes and his team of assemblers also encountered problems when tiny misalignments in connecting the elements built up and caused problems when assembling the final elements in the structures.
Advances in CAD software helped with some of the problems previously encountered, as the popularity of the Rhino 3D modeling product spurred the growth of a “ecosystem” of add-on products and related capabilities. For example, McNeel’s Grasshopper add-on provided a visual programming language to supplement traditional RhinoScript programs, while the third-party product RhinoNest optimized the process of “nesting” arbitrary structural elements onto flat sheets to be laser cut or milled with minimal wasting of material.
These advances were not panaceas. Fornes and his designers might now be able to create designs featuring arbitrarily-large numbers of unique structural elements and to nest those elements onto sheets for cutting or milling, but assembling such elements was still time-consuming—so time-consuming as to often be impractical for a small team working against a deadline.
One way Fornes reduced assembly time was to combine multiple individual elements into one elongated element, producing strips of material to be further combined into structural components. (See the figure above, in which painting some of the strips made this technique visible as colored stripes on the final structure.) But building a structure out of long strips could lead to other problems, as Fornes found when he designed a structure to be made of wood veneer and accidentally nested the strips in a way that went against the grain of the wood, thereby weakening them. (The resulting structure collapsed while being transported to the exhibition site.)
Nonetheless Fornes and his associates perservered in their pursuit of learning through failure and iterative improvement, and succeeded in creating more and more striking and successful projects: structures large enough to be experienced as spaces rather than just as sculptures, structures whose unassembled elements were small and light enough to be transported halfway around the world in the team’s suitcases (echoing the experiences of nomads who carried their homes with them), structures designed for easy storage when necessary, structures made of aluminum, or plastic, or carbon fiber—all leveraging an increasingly sophisticated repertoire of design, fabrication, and assembly techniques.
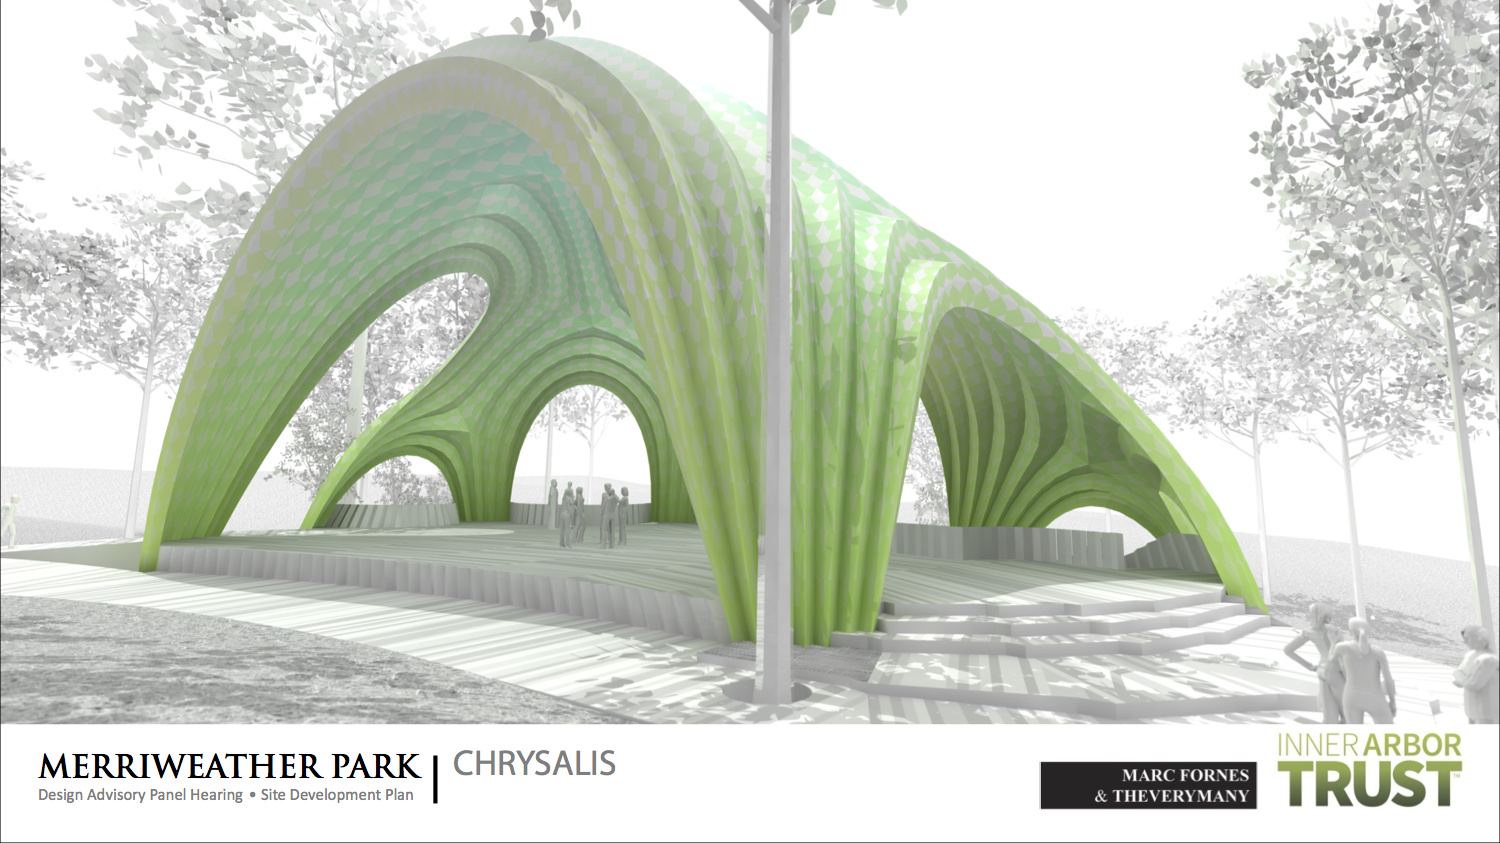
The Chrysalis design as rendered, showing the pleats in the surface. (Click for a higher-resolution version.) Adapted from the Inner Arbor Trust presentation to the Howard County Design Advisory Panel on February 26, 2014. Image © 2013 Marc Fornes; used with permission.
The genesis of the Chrysalis
As the second decade of the 21st century began, Marc Fornes received increasing attention as an architect to watch. In 2010 he quit his day job at a large architectural firm and converted THEVERYMANY from an informal project into an independent design studio, gaining more freedom to pursue his own projects. (As he put it to writer Terri Peters, “I realized nobody is ever going to commission me to do what I want to do, so I thought, what can I commission myself to do?”)
The years 2011 and 2012 saw a number of new projects for THEVERYMANY, including for the Centre Pompidou (shown above), FRAC Centre, and Atelier Calder in France, and Washington University at St Louis and Art Basel Miami in the US. Those years also marked the beginning of the events that would eventually lead to the creation of the Chrysalis.
As previously described, after his appearance at the Columbia Association resident “speak out” in September 2011 Michael McCall of Strategic Leisure began thinking seriously about creating a concept plan for a new park in Symphony Woods. Throughout 2012 McCall created a series of presentations outlining such a plan.
When creating Columbia, Jim Rouse had sponsored the work of Frank Gehry when Gehry was just starting his career; the results included Merriweather Post Pavilion and the Rouse Company headquarters building. In creating his concept plan for Symphony Woods (at the heart of Columbia), Michael McCall, formerly a Vice President at Rouse’s Enterprise Development Corporation, saw the opportunity to emulate his mentor by calling upon the talents of a new generation of promising architects. Thus when McCall created his concept plan presentations, to inspire his audiences and show how the plan might be implemented he highlighted the work of various innovative architects and artists, including in particular Marc Fornes.
In February 2013 McCall made a public presentation of the new “Inner Arbor” concept plan proposed by the Columbia Association as an alternative to the previous “Paumier plan”. Again this presentation mentioned Marc Fornes, in the context of the “Treehouse amphitheater” element of the concept plan.
In the subsequent months the Inner Arbor Trust was officially established and began the process of selecting designers for the various plan elements. In a presentation to Leadership Howard County in September 2013 McCall again mentioned Fornes as one of the designers who were candidates for possible commissions.
In that same presentation McCall also laid out the goals of the amphitheater element of the Inner Arbor plan: to serve as a stage for performances (including as a secondary stage for Merriweather Post Pavilion), as a pavilion for family reunions, church picnics, weddings, and similar events, and as a sculpture that would be a beautiful addition to the park during other times.
In November 2013 the Inner Arbor Trust formally announced the selection of Marc Fornes as part of the design team for the Inner Arbor plan, what Michael McCall termed the “Designers of Delight”. Shortly thereafter, at a community meeting on December 2, Fornes presented the design for what was now referred to as the “Chrysalis.”
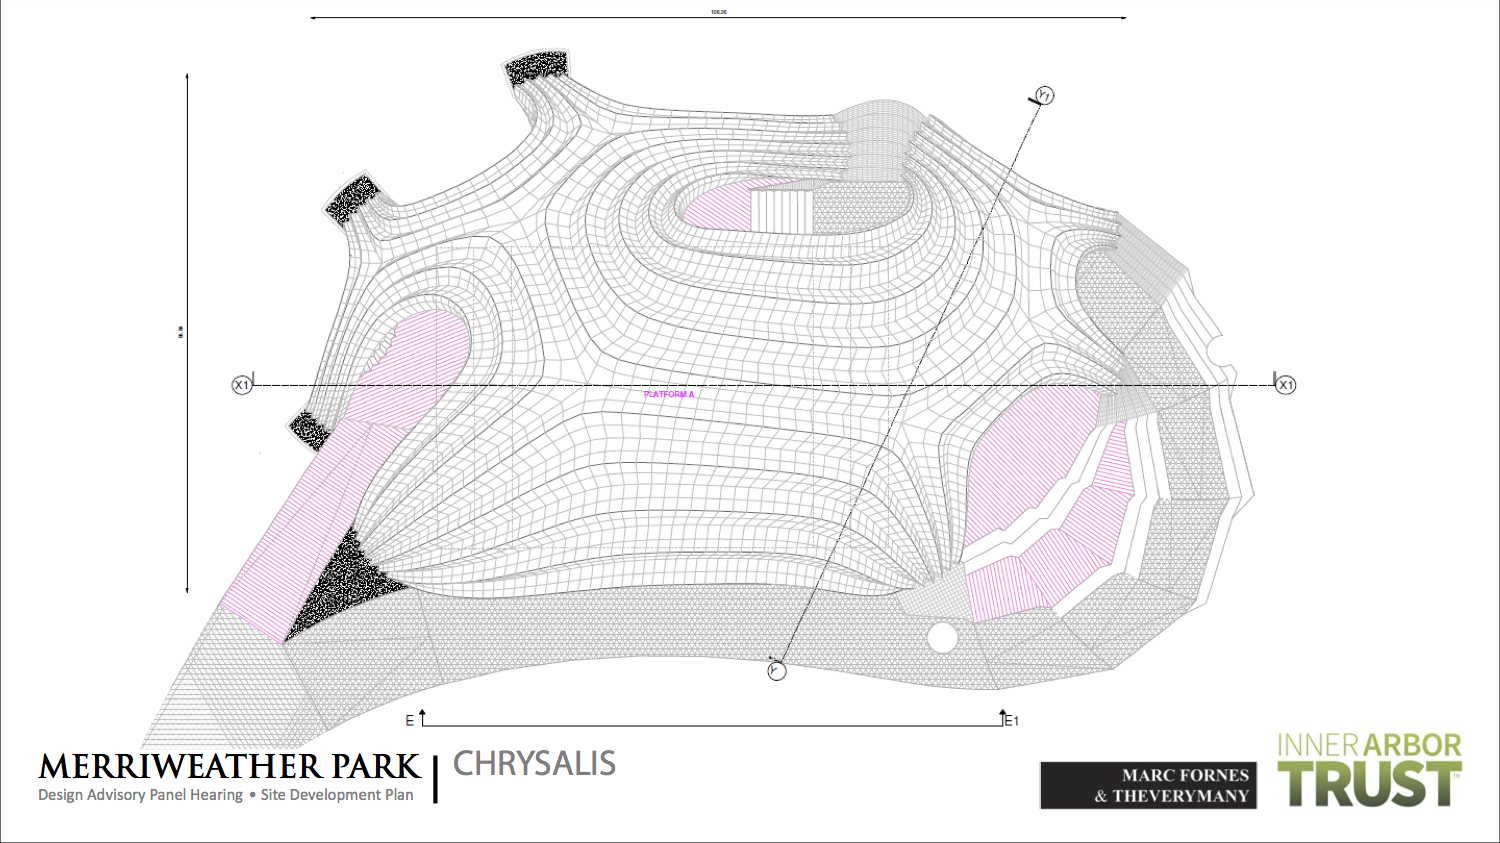
The underlying quadrilateral mesh of the Chrysalis design as seen from above after inflation. (Click for a higher-resolution version.) The darker lines in the mesh mark the peaks of the pleats. Adapted from the Inner Arbor Trust presentation to the Howard County Design Advisory Panel on February 26, 2014. Image © 2013 Marc Fornes; used with permission.
Mesh inflation
The design of the Chrysalis was created using a process Fornes called “pleated inflation,” a variant of “mesh inflation”. The technique of mesh inflation was made possible by the increasingly sophisticated applications built on the Rhino modeling software, including the Grasshopper visual programming language, the Kangaroo physics simulation add-on to Grasshopper, and similar tools.
In mesh inflation the tools start with a flat surface of a certain shape specified by the designer. The form of the surface will determine the final form of the structure. For example, in the Chrysalis mesh inflation (see the first figure above) the initial surface (outlined in yellow) has nine “projections” or “peninsulas” that will end up as the legs of the Chrysalis.
The tools then divide up the surface to create a mesh of four-sided shapes (quadrilaterals). In the case of the Chrysalis the lines of the mesh run “lengthwise” along the projections (purple in the first figure above) and “crosswise” across them (blue in the figure). The way those projections (or more specifically, the lengthwise lines of the mesh) join to each other then determines the way the “vaults” of the Chrysalis intersect with each other.
Once the mesh is defined, the tools then treat the lines of the mesh (the sides of the quadrilaterals) as if they were springs (of varying degrees of stiffness) connecting together the vertices of the mesh (the places where the lines of the mesh cross) and providing tension between them. The exact simulated stiffnesses can be tweaked by the designer to achieve various effects.
Some vertices at the edge of the mesh are constrained to remain attached to the “ground”. These places are to be the bases of the “legs” of the final structure. (For the Chrysalis these vertices are the ones at the ends of the nine projections of the initial surface.)
The tools then simulate an upward force applied to the vertices of the mesh. The simulated force causes the vertices to move vertically into the “air,” but they are constrained by the tension placed on them by the simulated springs between them, or (for designated vertices at the edge) by their attachment to the “ground.”
Other simulated forces can be applied in other directions, most notably outward from the surface as it evolves. The net effect is that the initially flat mesh “inflates“ into a 3-dimensional structure, analogous to a balloon being blown up or an inflatable tent being filled with air.
Fornes used the mesh inflation technique (what he called “a computationally derived dynamic spring network with behavioral attributes”) in designing the sculpture “Vaulted Willow” for Borden Park in Edmonton, Alberta. The first figure above and its linked video show a similar technique as used in creating the Chrysalis design.
The Chrysalis design as presented in the pre-submission meeting and to the Design Advisory Panel was more complicated than could be produced using the same type of mesh inflation used for the Vaulted Willow project. Instead Fornes used a variant technique he called “pleated inflation,” previously used in designing a structure of the same name in Argelès-sur-Mer in France.
In the pleated inflation technique certain “lengthwise” lines through the original mesh and their associated vertices are marked out as special. During the inflation process the simulated forces and/or tensions are varied such that the resulting surface is not smooth, but instead assumes a corrugated or pleated appearance, with the peaks of the pleats running along the previously marked lines.
In the Argelès-sur-Mer amphitheater, which is built solely from flat aluminum shingles folded and then riveted together, the resulting pleats supply stiffness to the overall architectural form and help ensure the integrity of the structure. The pleats in the Chrysalis also provide structural integrity, supplemented by additional elements as discussed below. In addition the Chrysalis pleats help channel rain water and snow melt off the structure.
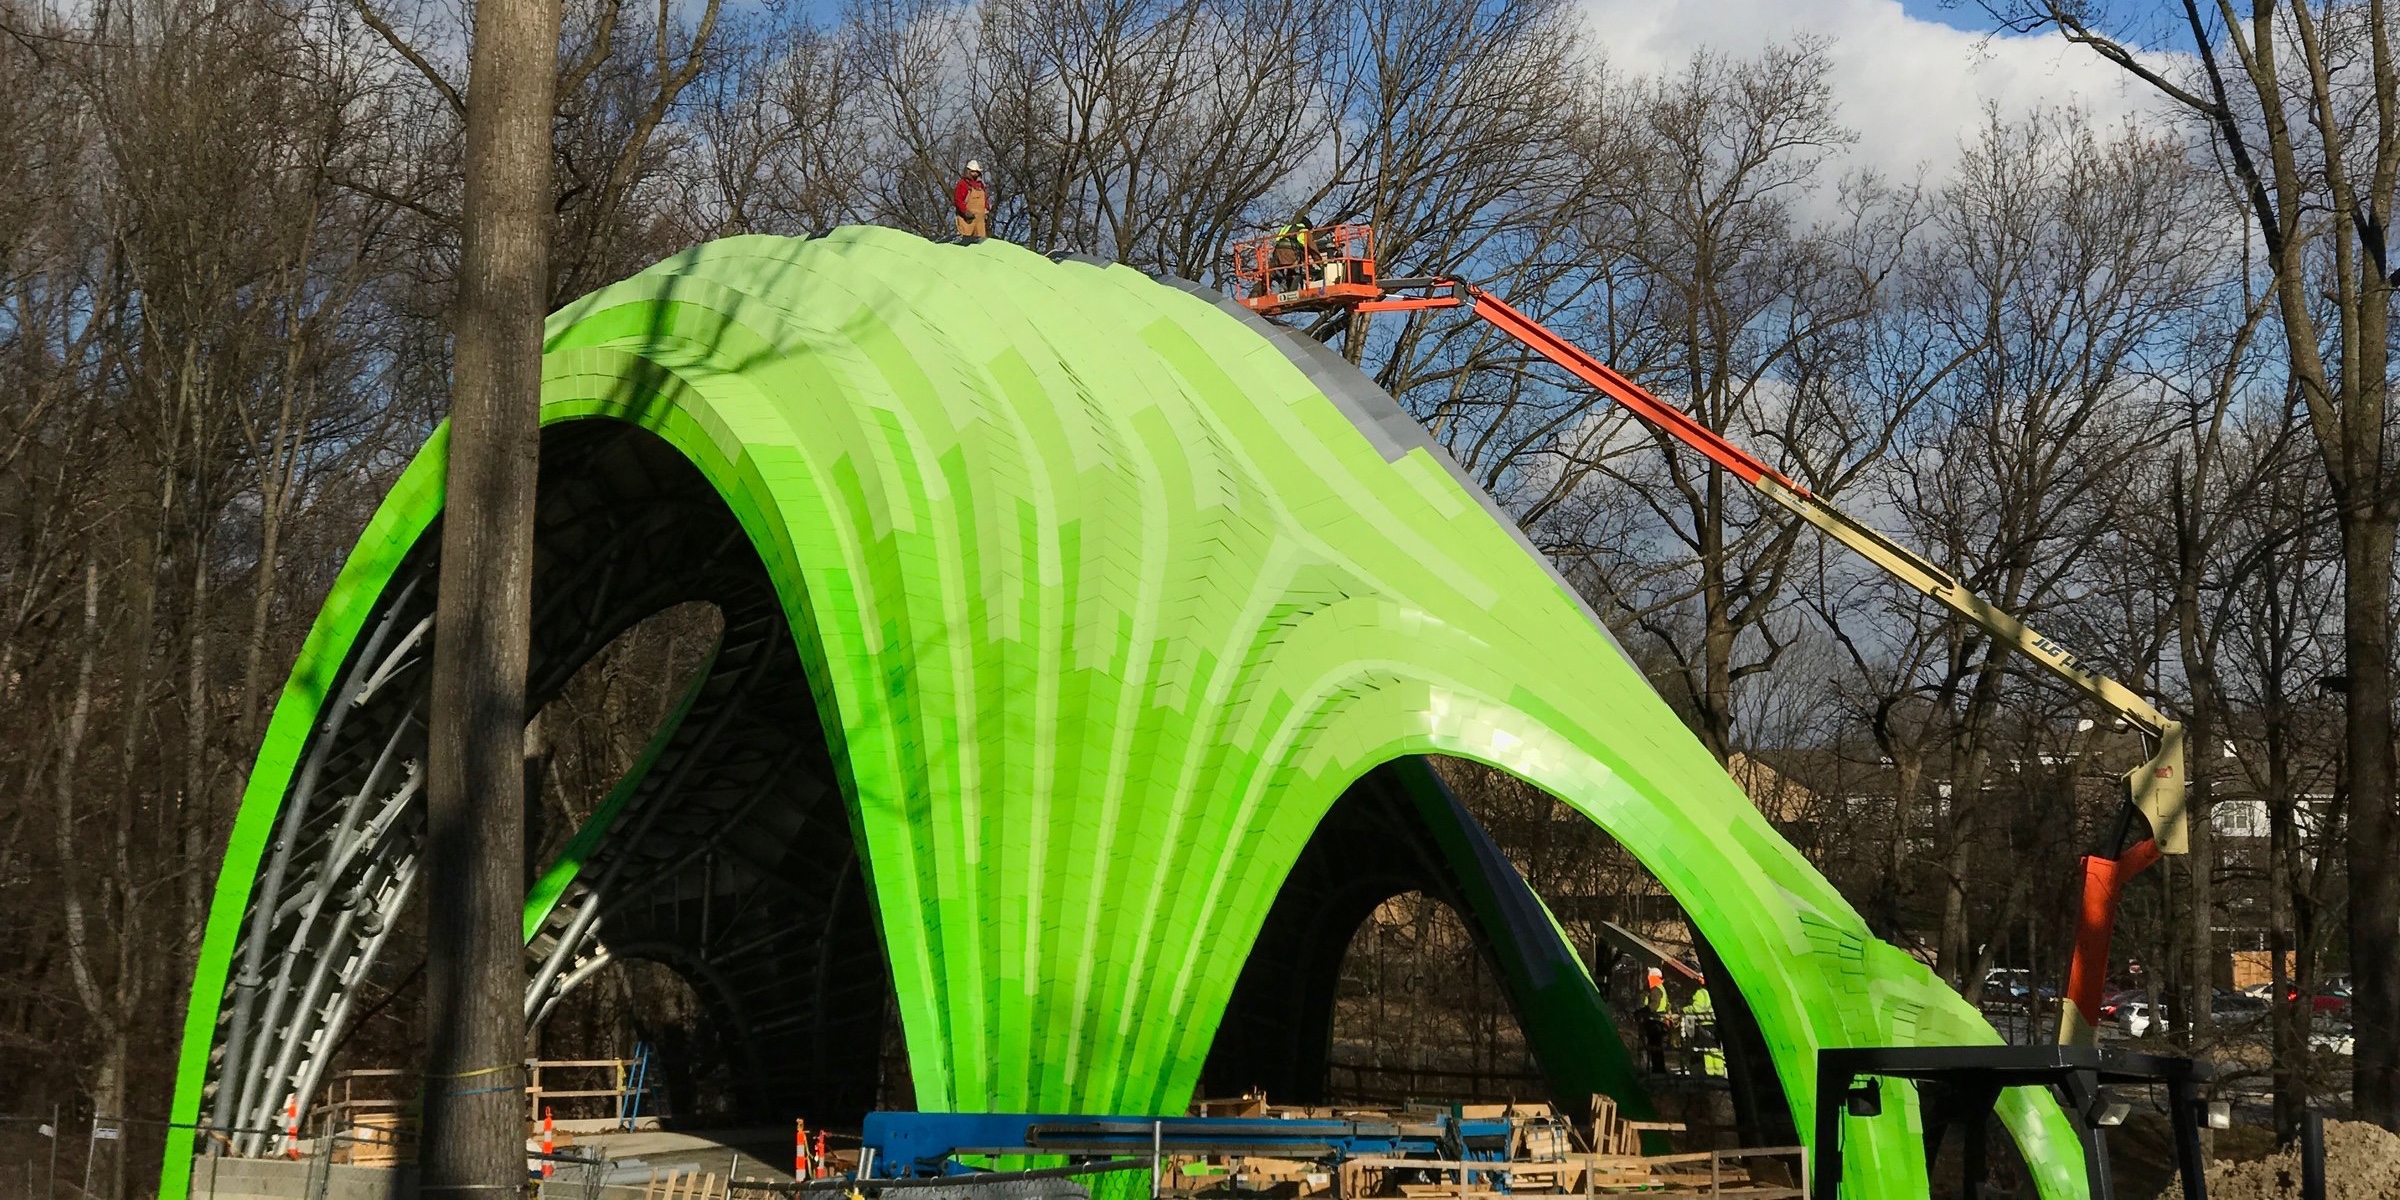
The Chrysalis under construction in the fall of 2016. (Click for a higher-resolution version.) Compare to the design rendering above. Image © 2016 Inner Arbor Trust; used with permission.
Sculpture, pavilion, stage
Recall again the three roles of the Chrysalis: as a sculpture, a pavilion, and a stage. As a sculpture the Chrysalis follows in the tradition of previous THEVERYMANY projects in its nonlinear form, though its shape is relatively simple and straightforward compared to projects like Y/Surf/Struc (shown above).
Though the Chrysalis design has a simpler shape than that of Y/Surf/Struc, it makes more sophisticated and subtle use of color. In structures like Y/Surf/Struc color was used mainly to highlight the underlying plan of the design—as Marc Fornes remarked, “It’s not for [the color] that we got invited [to the Centre Pompidou].”
Fornes used color more imaginatively and playfully in later projects like Vaulted Willow, befitting its role as a public art piece for a park. The aluminum shingles forming the structure go from predominantly purple and blue at the base to blue and green and then to green and yellow at the top, with the eye perceiving a gradient of color built from a series of single-color shingles.
The Chrysalis uses a similar scheme, albeit with a more restricted range of colors (being similar to the Pleated Inflation structure in that respect). As a larger structure in a wooded setting, its colors span a range of greens to echo its surroundings. As with Vaulted Willow, the Chrysalis as constructed (see the figure above) shows the effect of a sophisticated “dithering” technique, designed to use a limited color palette (only four colors of shingles in the Chrysalis) to simulate a broader range of colors. The end effect as perceived by the eye is a relatively smooth gradient running from a darker green at the bottom to a lighter green at the top.
In its role as a pavilion the Chrysalis differs from previous THEVERYMANY projects mainly in being designed to provide a solid shell. Previous projects, including the Pleated Inflation amphitheater, used shingles that were perforated in various ways, using a technique to determine the shape and location of the perforations that Fornes calls “agent-based porosity”. Since the Chrysalis is intended for uses such as picnics and weddings that might be held in inclement weather, its surface is solid and designed (using the pleats) to channel water away from participants.
The Chrysalis is also considerably larger than any other THEVERYMANY project, easily twice the width, depth, and height of its “little brother,” the Pleated Inflation structure. This means that the area under the shell (about five thousand square feet in total) is much larger than that associated with the other projects, providing sufficient room to shelter fairly large gatherings.
The final role of the Chrysalis, as a performance stage, put the most demands on the design. The Chrysalis stage is actually two stages in one: the larger or “alpha” stage facing west, and a smaller “beta” stage facing south. These stages were not intended just for community and school plays and concerts and other relatively small-scale events. Instead the alpha stage was also intended to serve as a secondary stage for Merriweather Post Pavilion, for example during large music festivals.
Over the years the increased appetite of concert-goers for elaborate productions has led acts to impose ever greater technical requirements on the venues seeking to host them: more stage space, greater electrical capacity, and—most important—the ability to hang ever larger and heavier lighting rigs and audio equipment.
In the case of Merriweather Post Pavilion this trend led to the eventual replacement of the existing stage and stagehouse with larger facilities. In the case of the Chrysalis it greatly increased the loads that the Chrysalis would have to bear, as specified in the technical requirements worked out among the Inner Arbor Trust, I.M.A. (the operators of Merriweather Post Pavilion), and other parties.
In particular the Chrysalis shell would have to support a much greater load due to hanging equipment (up to 40,000 pounds in total per the technical requirements), and a correspondingly greater risk of having “point loads” damage the structure. (For example, think of roadies inadvertently attaching heavy equipment at one place on the structure without balancing the load at attach points elsewhere.)
This load was in addition to the static load of the structure’s own weight, potential additional load due to snowfalls, and potential dynamic loads due to high winds hitting the structure from various angles. The total surface area upon which wind can act is much greater for the Chrysalis than for other THEVERYMANY projects, and the resulting wind force correspondingly larger. The planned-for wind load, at about 60,000 pounds, is actually higher than the anticipated load due to theatrical equipment.
Given the anticipated and planned-for loads, the Chrysalis does not rely solely on pleated metal shingles to provide structural integrity. The Chrysalis design uses pleated shingles for the outer surface and then supplements them with an inner framework of curved steel elements underneath the shingles. (See future articles in this series for more information on this steel framework and the means by which the shingles are attached to it.)
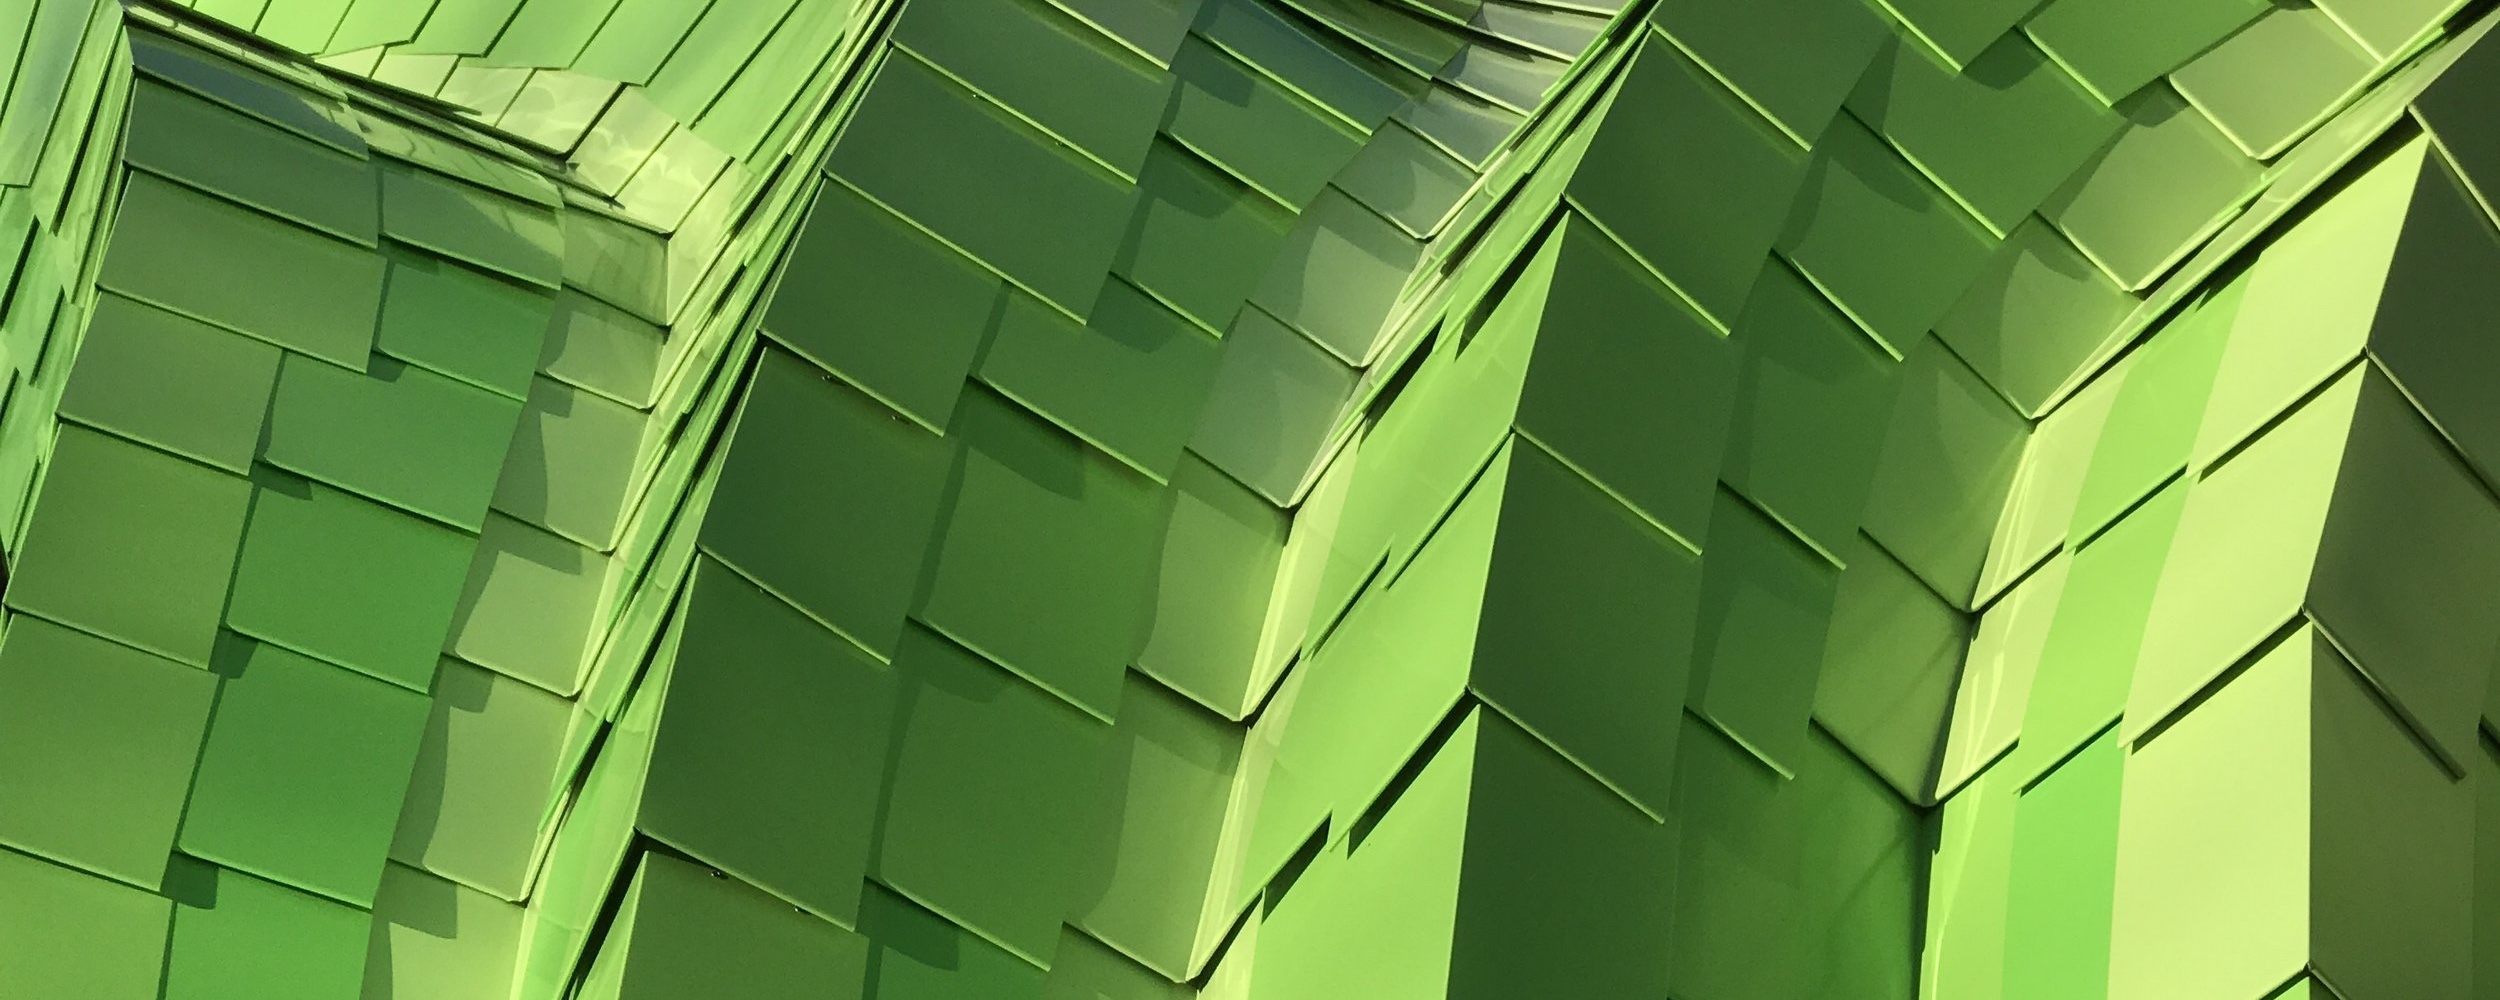
A close-up of the Chrysalis shingles showing the different colors used. (Click for a higher-resolution version.) Image © 2016 Inner Arbor Trust; used with permission.
The significance of the Chrysalis
The Chrysalis is special in many ways. First, it represents the largest structure yet designed by Marc Fornes, and in its role as a modern performance stage must meet more demanding real-life requirements than any previous THEVERYMANY project. Its creation marks another step in the evolution of Fornes as an architect and THEVERYMANY as a studio, consistent with his goal to “learn, grow, and grow in scale.”
Second, for the Inner Arbor Trust the Chrysalis is the first element of the Inner Arbor plan to take tangible form. Its successful completion confirms the wisdom of the Columbia Association in investing the Inner Arbor Trust with the responsibility of creating a new park for Symphony Woods, and helps position the Trust for future success in carrying out the remainder of the Inner Arbor plan.
Finally, for the people of Columbia and Howard County, who funded the design and construction of the Chrysalis and will be its primary users, the Chrysalis is a unique and beautiful addition to downtown Columbia, fully capable of fulfilling its roles as stage, pavilion, and sculpture, and a structure that—along with a renovated Merriweather Post Pavilion—will serve as an anchor around which the vision of Merriweather Park at Symphony Woods can be realized.
For further exploration
This article is based on material from a variety of online sources, including the following:
For more on Bézier and NURBS curves see the following:
- “On the Spline: A Brief History of the Computational Curve,” by Alastair Townsend. A non-mathematical explanation of the historical and technical aspects of Bézier and NURBS curves.
- “A History of Curves and Surfaces in CAGD,” by Gerald Farin. A more technical history of computer aided geometric design.
- “My Time at Citroën,” by Paul de Casteljau. An autobiographical article that provides some amusing insights concerning de Casteljau and the environment in which he worked at Citroën.
- “NURBS-Calculator.” An interactive web-based demo that allows you to manipulate and create NURBS and Bézier curves. (You can even use it on smartphones and tablets.)
For more on architectural design software and associated techniques see the following:
- “The Software Behind Frank Gehry’s Geometrically Complex Architecture,” by Lian Chang. Outlines the history behind the adoption of CATIA for Frank Gehry’s projects.
- “The Way of Rhino” (part 1, part 2, part 3, and part 4), by Randall Newton. A 2007 series of articles providing an in-depth look at Robert McNeel & Associates, creators of Rhino, and their impact on the CAD market.
- “Rhino Grasshopper,” by Martyn Day. A 2009 article describing the then-new Grasshopper add-on to Rhino for visual scripting of geometry.
- “Grasshopper Primer,” by Mode Lab. For readers who are programmers this offers an interesting glimpse into a visual programming language specialized for manipulation of geometric objects.
For more on Marc Fornes and his work see the following:
- theverymany.com is the most comprehensive source of information on Fornes and the work of THEVERYMANY. In addition to the projects highlighted on the main page, the archived blog posts on theverymany.com form a continuous record of Fornes’s work from late 2005 to 2014. (Keep scrolling to read earlier posts.) The posts in 2006 and 2007 are particularly interesting for their inclusion of sample RhinoScript code.
- “Marc Fornes Creates Spaces He Has Never Seen Before,” by Terri Peters. A 2010 article that provides a good summary of Fornes’s design philosophy and working methods.
- “Tech Specs: Marc Fornes, Founder of THEVERYMANY,” by Mason Currey. A 2015 article in which Fornes discusses the computer software and other tools he uses in his work.
- scriptedbypurpose. A 2007 exhibition curated by Fornes, its website contains many examples of experimental designs produced by RhinoScript code.
- (n)Certainties (original, v2.0, v3.0, v4.0, and v5.0). A series of workshops held at Columbia and USC from 2007 to 2009 by Fornes, Francois Roche, and Stephan Henrich, their websites also contain many experimental designs with accompanying RhinoScript code.
- “D01 06 Marc Fornes Structurant Bark” [40-minute video]. A presentation by Marc Fornes at the symposium “PROTO/E/CO/LOGICS 002: The Field is Open,” held September 1-2, 2012, in Rovinj, Croatia. It includes discussions of the series of “prototypical structures” and lessons learned in creating them.
- “Unabashed Designers of Delight” [121-minute video] (November 18, 2013). A presentation introducing the design team for the Inner Arbor plan. It includes a presentation by Marc Fornes beginning at 58:26 that discusses a number of THEVERYMANY projects, including the amphitheater at Argelès-sur-Mer.
- “The Art of the Prototypical” [74-minute video] (October 26, 2015). A presentation by Marc Fornes at his alma mater, the Design Research Lab of the Architectural Association in London. It includes a discussion of more recent projects, including brief comments on the Chrysalis.
For more on the Chrysalis amphitheater and its origins in the Inner Arbor concept plan, see the following:
- Michael McCall’s presentation of the Inner Arbor concept plan to Leadership Howard County [33-minute video] (September 20, 2013).
- The Chrysalis portion of the Inner Arbor pre-submission community presentation (December 2, 2013).
- Michael McCall presentation to the Howard County Design Advisory Panel [20-minute video] (February 26, 2014).
- “Chrysalis mesh inflation” [68-minute video]. A video showing the process of mesh inflation for the Chrysalis. Note that most of the video is blank, with the only content being the initial two minutes and from 41:40 on.
- “Mesh pleated inflation, Argeles” [2-minute video]. A brief video showing the process of mesh inflation for the “Pleated Inflation” amphitheater in Argelès-sur-Mer, including the creation of the pleats in the surface (not shown in the equivalent Chrysalis video).
For more of my opinions on and explanations of various aspects of the Chrysalis and Merriweather Park at Symphony Woods, see the Inner Arbor-related posts in the series “The Inner Arbor plan takes shape” and elsewhere on this blog. (Note that some of these posts contain outdated information relating to park features that were later dropped or revised.)
Bernstein polynomials are a special type of polynomial discovered in the early 1900s by the mathematician Sergei Natanovich Bernstein, who showed that they could be used to approximate any continuous function on a closed interval. For example, the Bernstein polynomials of degree 2 are (1 - t )2 , 2t (1 - t ), and t 2 . (In standard form these are t 2 - 2t + 1, -2t 2 + 2t , and t 2 .) Note that only the first polynomial is nonzero when t = 0, and only the last polynomial is nonzero when t = 1; this is a general property of Bernstein polynomials. ↩︎
More specifically, the point on the curve corresponding to a particular value of t is a linear combination of the control points, with the coefficient for each control point being the value of that point’s associated Bernstein polynomial for that value of t . ↩︎
The work at Citroën was first referenced in the public literature in 1971, and de Casteljau’s role in that work was first revealed in the late 1970s. Many years later de Casteljau was honored by the Solid Modeling Association, receiving its 2012 Bézier Award. ↩︎
In mathematical terms this smoothness has to do with the continuity of the derivatives of the function defining the curve in terms of its underlying parameter: C0 continuity means the curve’s function is continuous, C1 continuity that the first derivative of the function is continuous, C2 continuity that the second derivative is continuous, and so on. If a curve lacks C0 continuity at certain points then it will have gaps at those points, and if it lacks C1 continuity it will have kinks. C1 continuity (or a weaker form known as G1 geometric continuity) is the minimum requirement for the curve to appear smooth, with a fully-pleasing smoothness typically requiring at least C2 (or G2 ) continuity. ↩︎
The order of a spline function is one greater than the degree of the polynomial expressions of which it is composed. Thus a spline function containing cubic polynomials (i.e., of degree 3) has order 4. The order in turn determines the number of B-spline functions for that type of spline—there are four such functions in our example. ↩︎
As noted, Rhino began life as a product available solely for Microsoft Windows. The scripting language RhinoScript was based on the language used in Microsoft’s Visual Basic product. Later McNeel added the ability to use the popular open source programming language Python as an alternative to RhinoScript, and ported Rhino to Mac OS X. ↩︎
If you’re reading these footnotes you presumably know what recursion and fractals are. See Wikipedia for more information on L-systems, cellular automata, vector fields, Voronoi tesselations and Delaunay triangulations. ↩︎