
Click for a higher-resolution version. Graph by Frank Hecker, made available under the CC 1.0 Universal Public Domain Dedication.
tl;dr: Looking at median household income in Maryland over time compared to DC and Virginia.
With so much attention paid recently to the issue of housing affordability in Howard County, together with related concerns about county taxes, developer impact fees, the school system budget, adequate public facilities, and so on, I decided to take a look at these issues myself.
Instead of throwing some opinions out there without any support, I’m first taking a look at what data I can find that’s relevant to the issue, starting with data on household income and how that’s changed over time. After all, household income, along with house prices, is a key factor in how affordable Howard County is, both to existing residents and those hoping to move here.
I’d really like to look at income data specifically for Howard County, but unfortunately I can’t find any US Census Bureau income data at the county level until the 2000s. I’m therefore starting with data on median household income at the state level.
Recall that “median” means half of all households have less income than this value, and half more. Median income is a better measure than average income, which can be skewed by great inequality, especially at the high end of the income scale. And household income is a better measure than per capita income, since almost by definition it’s households that buy houses.
Above you can see the data over the last thirty years or so for Maryland, DC, and Virginia, as well as for the US as a whole. These values are inflation-adjusted, expressed in 2017 dollars. I also used the 3-year average to smooth out spikiness in the values, whether due to sampling issues or year-to-year economic fluctuations. Thus the figure for (say) the year 2000 is actually the average for 1998, 1999, and 2000, and the latest value for 2017 also reflects income levels in 2015 and 2016.
Here are some quick take-aways from the above graph:
First, at least for the past thirty years Maryland median household income has always been higher than that for the US, as well as higher than median household income for both DC and Virginia (although DC has been quickly closing that gap).
Second, US median household income has not increased very much in real terms over time: less than $10,000 in 2017 dollars over thirty years, or about $300 per year. Virginia’s median household income has risen even more slowly than that.
Using median household income as a measure of household affluence has been criticized because it does not include non-salary benefits like employer-paid health insurance. This may make the relative stagnation of US median household income less serious of a problem than it otherwise appears. However there’s no question that Virginia households overall have done less well than those in Maryland and DC over the last thirty years.
Click for a higher-resolution version. Graph by Frank Hecker, made available under the CC 1.0 Universal Public Domain Dedication.
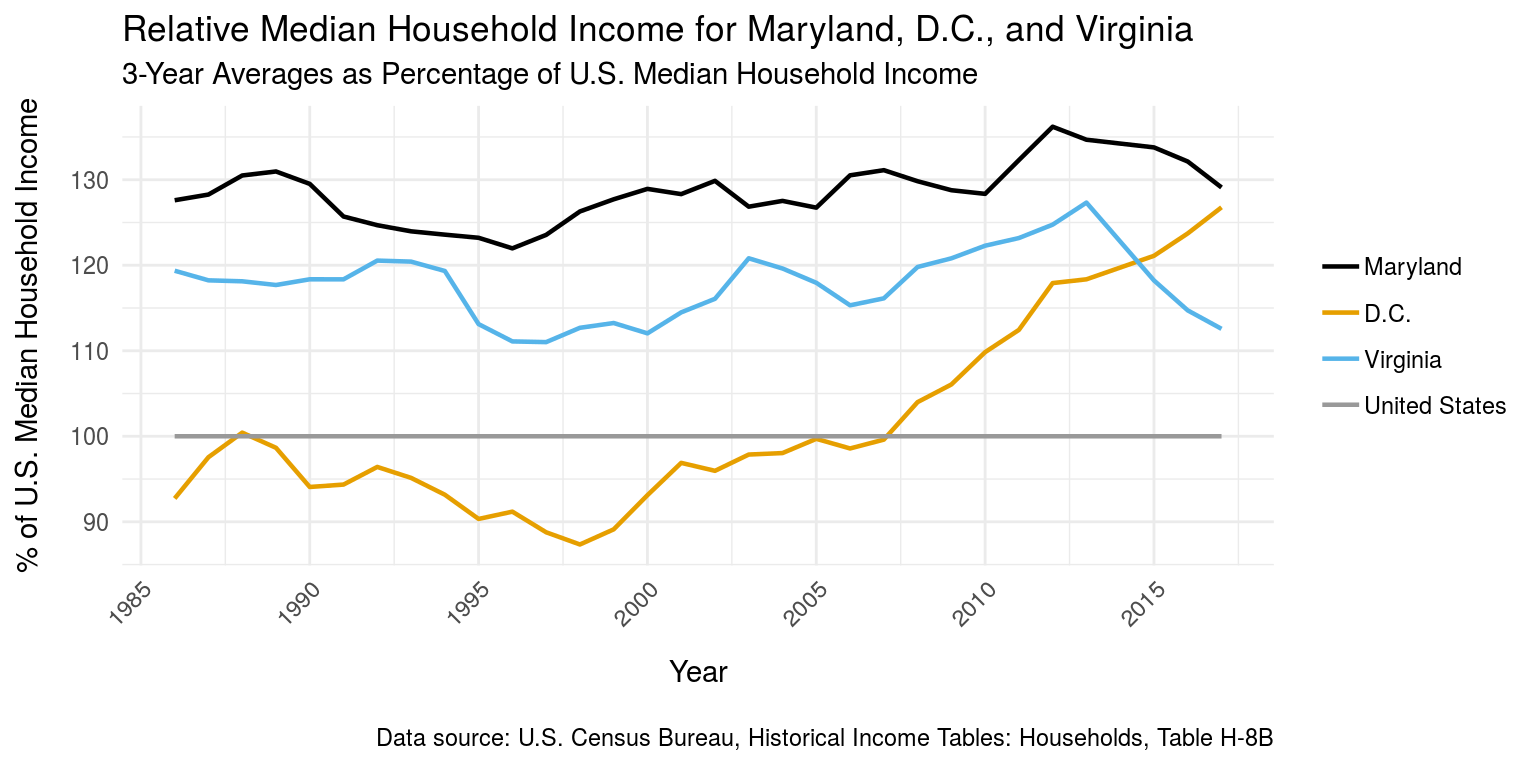
To get a better feel for how the local jurisdictions have fared relative to one another and to the US as a whole, here’s another graph showing median household income for Maryland, DC, and Virginia as a percentage of the US median household income (the horizontal line at 100%). Again, this uses the 3-year averages for median household income.
My take-aways from this graph:
First, Maryland median household income has been between 120 and 130% of US household median income for most of the past thirty years. It reached its high point in the early part of this decade, but has suffered a relative decline in the past few years. In looking at the first graph above, it appears that the relative decline has occurred because recently US median household income has been rising faster than Maryland median household income.
Second, Virginia median household income has been between 110 and 120% of US household median income for most of the past thirty years. Like Maryland, it reached its high point in the early part of this decade, but has suffered an even sharper relative decline in the past few years.
Finally, DC has undergone a startling change from the 1990s, when its median household income was less than 90% of US median household income. Today its median household income rivals the median household income of Maryland, and if we look at the 1-year estimates (not shown above) actually surpasses it.
In general median household income in a jurisdiction can rise either because existing households become more affluent, or because less affluent households leave the jurisdiction and are replaced by more affluent ones. I haven’t done any research on what’s happening in DC with respect to in- and out-migration, so I can’t say which factor might have been more important.
Click for a higher-resolution version. Graph by Frank Hecker, made available under the CC 1.0 Universal Public Domain Dedication.
People love to see how they’re doing in national rankings, so here’s a graph showing how Maryland, DC, and Virginia have ranked against the other US states1 over the past thirty years. For consistency I have used the same 3-year averages for median household income, although note that news articles about income rankings will almost always be based on the 1-year estimates.
Maryland has been in the top five states for almost all of the past thirty years, and has been number one in the rankings in recent years. Virginia has consistently been in the top ten states by median household income, although it has recently dropped out of the top ten.
Finally, DC has gone from the bottom ten to the top ten in the span of twenty years. In the rankings based on 1-year estimates it is now ranked number one, higher than any US state.
Further exploration
For more on how I created the graphs above, see the following:
- “Maryland median household income over time” shows the R code used to produce these and other graphs.
- My hocodata code repository includes copies of the raw data files and R Markdown files for this and another analyses. (Look in the “affordability” subdirectory.)
- If you sign up for a free account on the Rstudio.cloud service you can open and make a copy of my hocodata project for this and other analyses, and try your hand at it yourself. (Again, look in the “affordability” subdirectory, and check out the RStudio.cloud primers.)
Yes, I’m counting DC as a state here. In US census data it typically is included in state-level datasets, sometimes with Puerto Rico as well. ↩︎