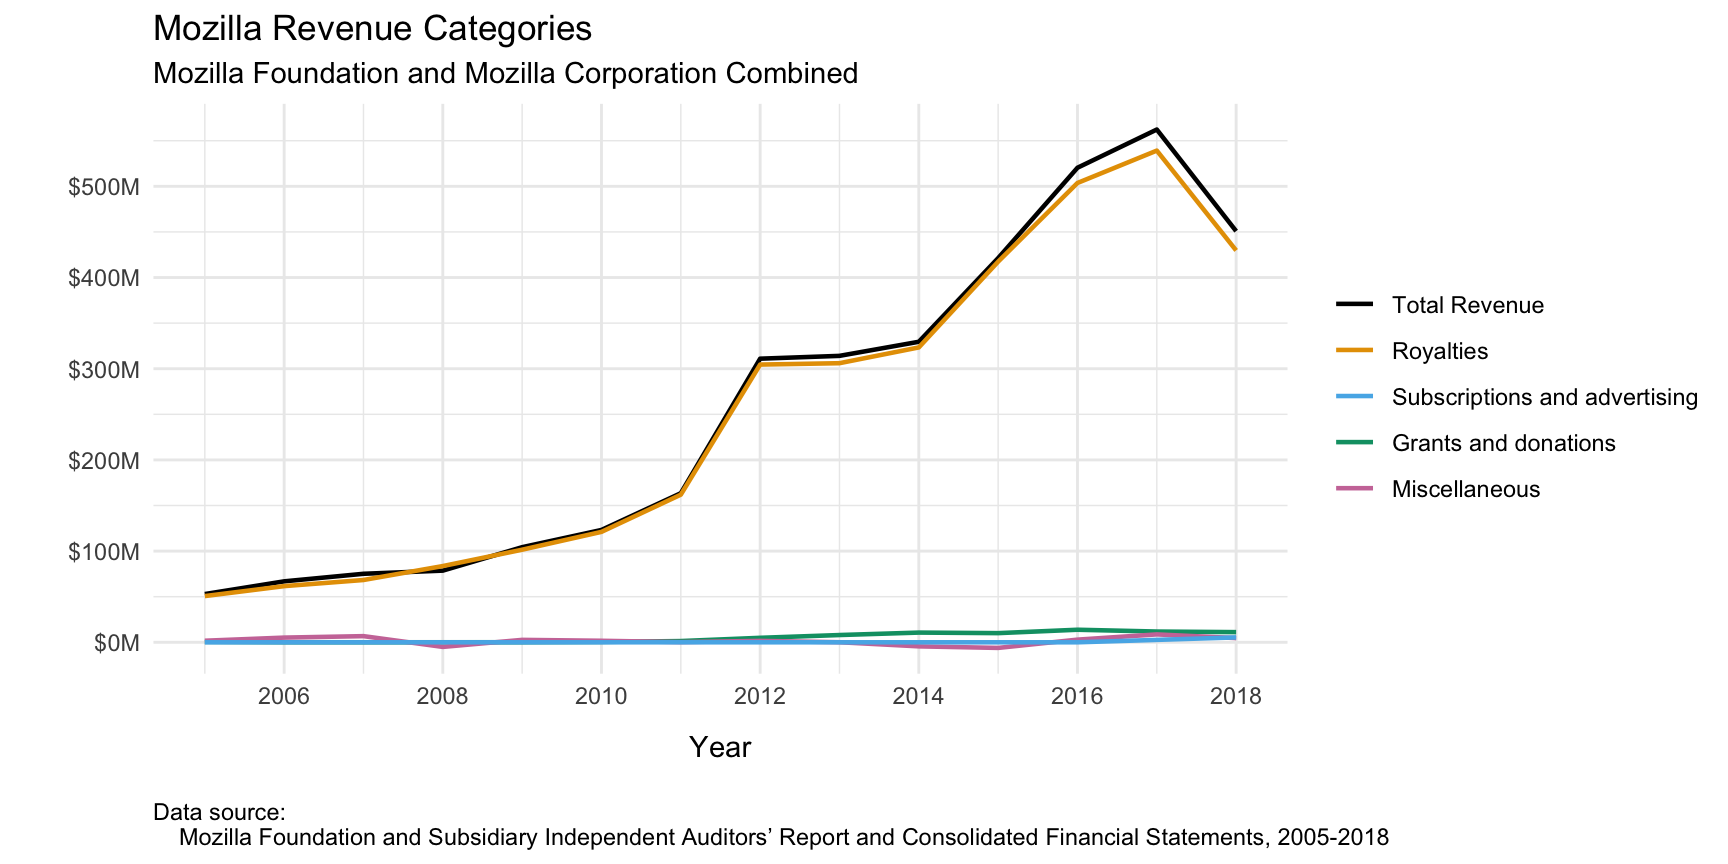
This graph shows the main categories of revenue for the combined Mozilla Foundation and Mozilla Corporation from the Corporation’s founding in 2005 through 2018. Graph © 2020 Frank Hecker, made available under the Creative Commons Attribution 4.0 International license.
tl;dr: Four graphs show that almost all of Mozilla’s revenue comes from Google et al., and the majority of its expenses go to software development.
In my last post about Mozilla I included a bit of data and a lot of opinions. In this post I’ll reverse that and provide more data and fewer opinions.
I was interested in knowing at a high level what were the major categories of Mozilla’s revenue and (what’s a bit more interesting) what were the major categories of Mozilla’s expenses. To do this I went through the consolidated financial statements for the Mozilla Foundation and Mozilla Corporation, extracted the data I was interested in, and applied a bit of R code.
The graph above shows the major categories of revenue for Mozilla from 2005 through 2018, the last year for which we have financial data. Note that I consolidated some categories of revenue to simplify the graph. For example, I combined income from interest and dividends, investment gains and losses, and similar categories into an overall category of miscellaneous revenue.
The results are not surprising: by far the major driver of revenue was royalties received from Google and other search engine vendors, with everything else (including grants and donations to the Mozilla Foundation) being relatively negligible.
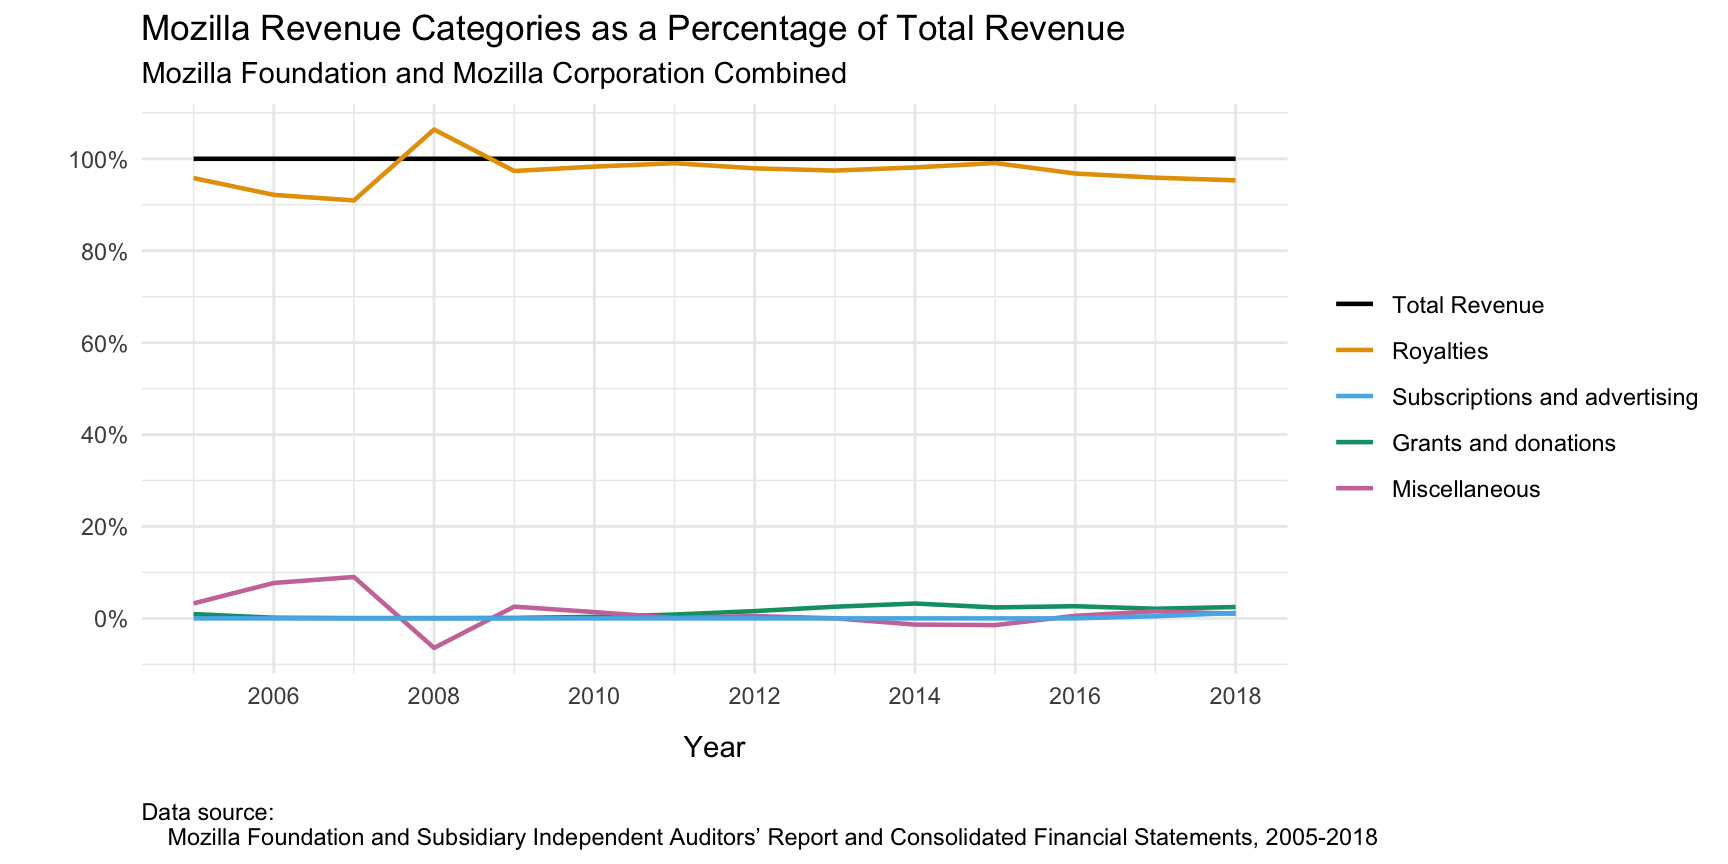
This graph shows the main categories of revenue for the combined Mozilla Foundation and Mozilla Corporation from the Corporation’s founding in 2005 through 2018, expressed as a percentage of total revenues. Graph © 2020 Frank Hecker, made available under the Creative Commons Attribution 4.0 International license.
The data for the various high-level categories is bit more interesting when expressed as a percentage of total revenue. Again, royalties from Google and other search engine providers dominate the picture, never going below 90% of total revenue and typically at 95% or greater.
There’s one interesting anomaly for the years prior to 2009, in which miscellaneous income rose to almost 10% of total revenue and then dropped below zero (i.e., it constituted a net loss). This appears to be due to Mozilla Foundation and/or Corporation investments doing well in the run-up to the financial crisis of 2008, and then suffering losses. Since 2009 miscellaneous income has been more stable as a percentage of total revenue, possibly due to the favorable economic environment and/or more conservative investment strategies.
Also, for future reference note the category relating to subscriptions and advertising, which is currently under 5% of total revenues. I presume that revenues relating to Pocket are assigned to that category, and that revenues from the Mozilla VPN and other services will go there as well. It will be interesting to see in future financial statements whether that category grows substantially as a percentage of total revenue. That will be a key indicator of whether Mozilla is going to be able to move beyond its dependence on Google and other search engine providers.

This graph shows the main categories of expenses for the combined Mozilla Foundation and Mozilla Corporation from the Corporation’s founding in 2005 through 2018. Graph © 2020 Frank Hecker, made available under the Creative Commons Attribution 4.0 International license.
The graph above shows the main categories of expenses incurred by the Mozilla Foundation and Mozilla Corporation considered together. As one might expect, the largest category of expenses is for activities related to software development, including the salaries of the software developers themselves.
The next two largest categories are marketing, i.e., activities relating to promotion of Mozilla products and services, and general and administrative, i.e., all the support activities needed to keep Mozilla running, including the salaries of people not involved in software development. It’s interesting to note that marketing-related expenses seem to have leveled off somewhat in the years leading up to 2018.
The programs category includes things other than software development that further the nonprofit goals of Mozilla. Mozilla Foundation grants and fellowships go here, among others.
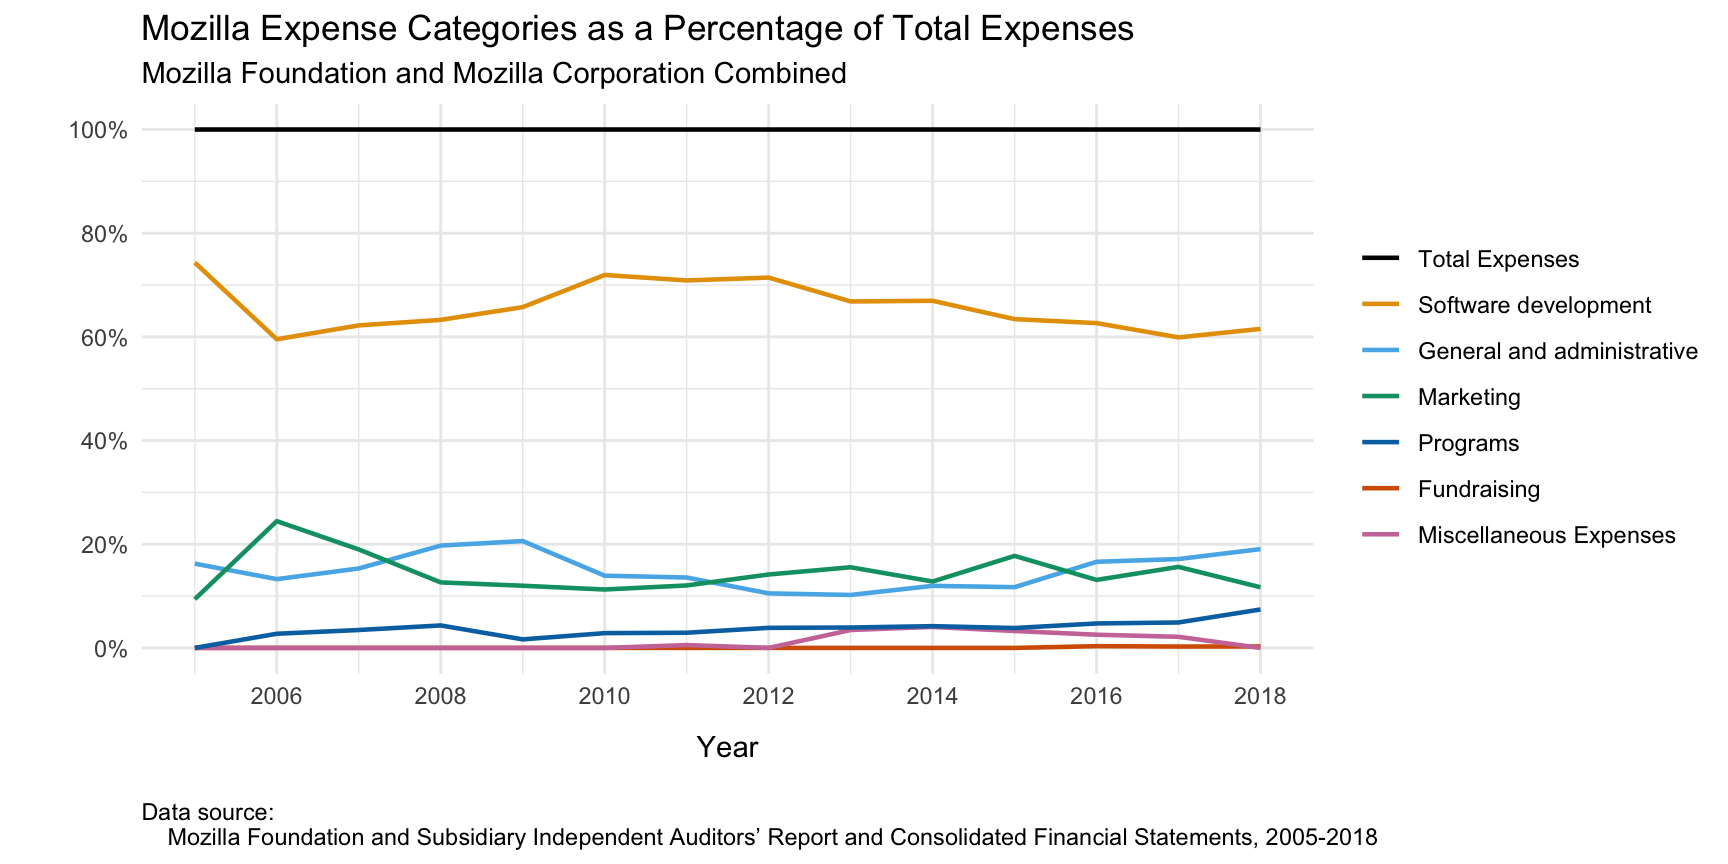
This graph shows the main categories of expenses for the combined Mozilla Foundation and Mozilla Corporation from the Corporation’s founding in 2005 through 2018, expressed as a percentage of total expenses. Graph © 2020 Frank Hecker, made available under the Creative Commons Attribution 4.0 International license.
The final graph shows the data in the previous graph expressed as a percentage of total expenses. Here again we see the large amount of expenses relating to software development, just above 60% in the years leading up to 2018.
Marketing and general and administrative expenses have tended to be in the range of 10% to 20%, with marketing sometimes higher than G&A and sometimes lower. Finally, program-related expenses have been rising in the years leading up to 2018, and if this trend continues in 2019 and beyond may come to make up around 10% of total Mozilla spending.
That concludes this brief tour of Mozilla’s finances. There is more that could be said about Mozilla’s finances, but that’s a task I will leave to others; see the section below for how to get started.
Finally, thanks to all who read my prior post and tweeted about it, and to those who ended up following me on Twitter or subscribing to my (very occasional) newsletter. If you’re interested in more of my thoughts on Mozilla I will likely end up disappointing you: this will probably be my final Mozilla-related post for a while, and perhaps forever. Feel free to unfollow me or unsubscribe unless you have an interest in whatever other topics I might end up writing about next.
For further exploration
For the calculations and data behind the graph above, see “A high-level overview of Mozilla finances” and the source code for that article in the mozilla-finances code and data repository.